3 Selection
This chapter is about the ‘Selection’ analysis in the ‘Audit Sampling’ section of the module.
3.1 Purpose of the analysis
The main goal of the selection analysis is to draw a representative sample of items from the population. These items can then be marked in the population file so they can be easily identified and tested. Particularly in an audit context, special sampling methods, such as monetary unit sampling, are used to ensure the sample has specific characteristics or meets certain criteria, such as always including items with a high book value.
3.2 Practical example
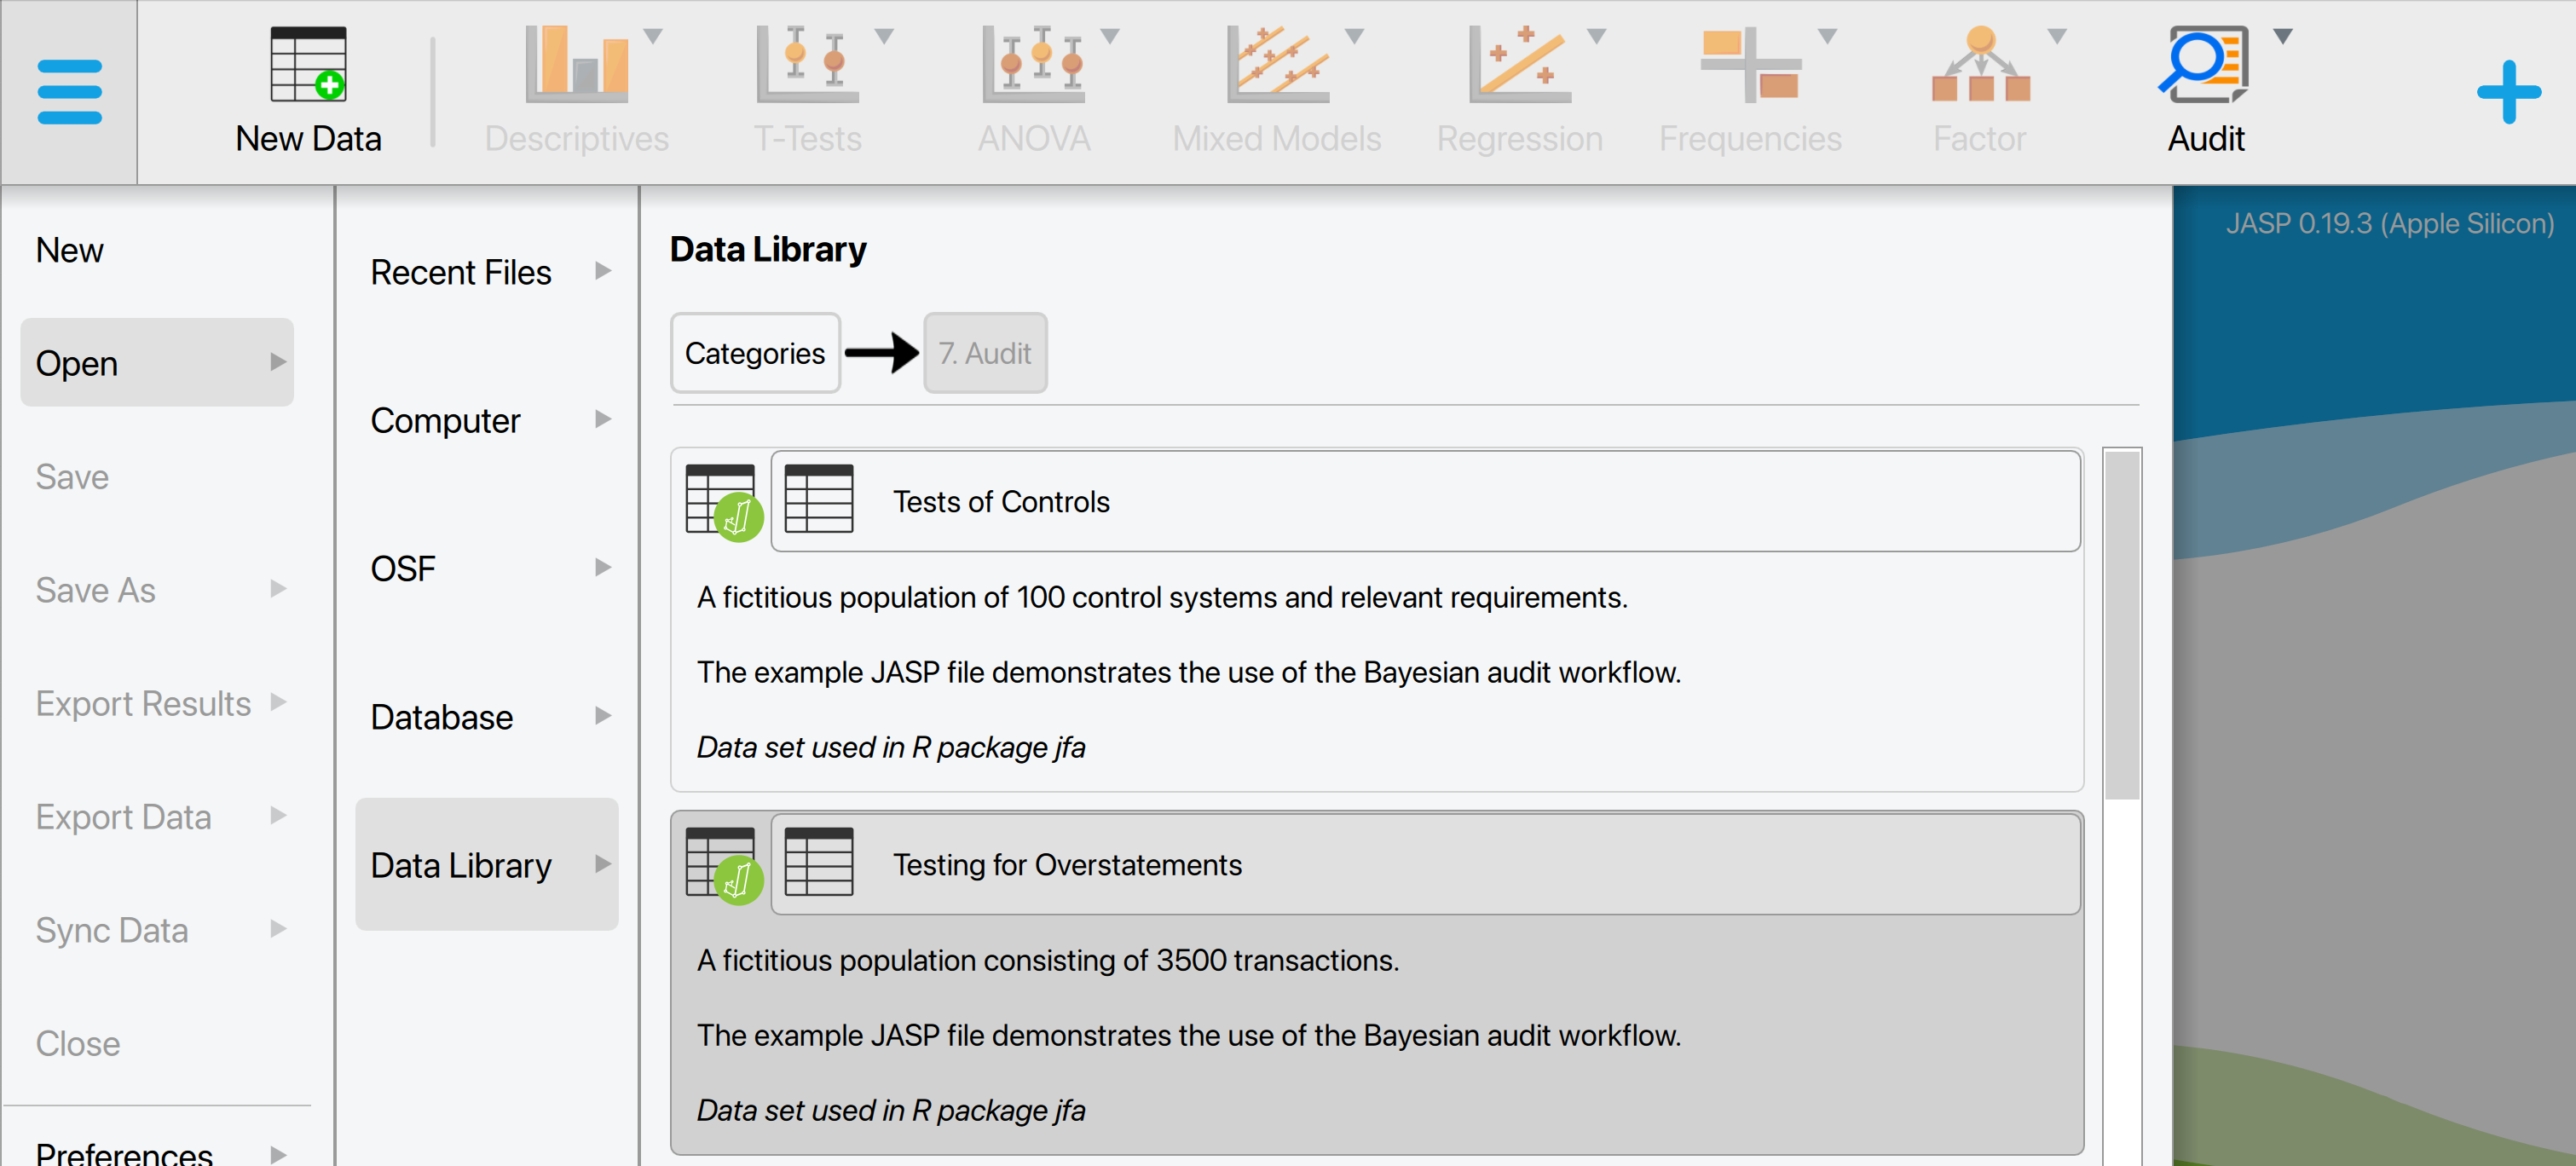
Let’s explore an example of a selection analysis. To follow along, open the ‘Testing for Overstatements’ dataset from the Data Library. Navigate to the top-left menu, click ‘Open’, then ‘Data Library’, select ‘7. Audit’, and finally click on the text ‘Testing for Overstatements’ (not the green JASP-icon button).
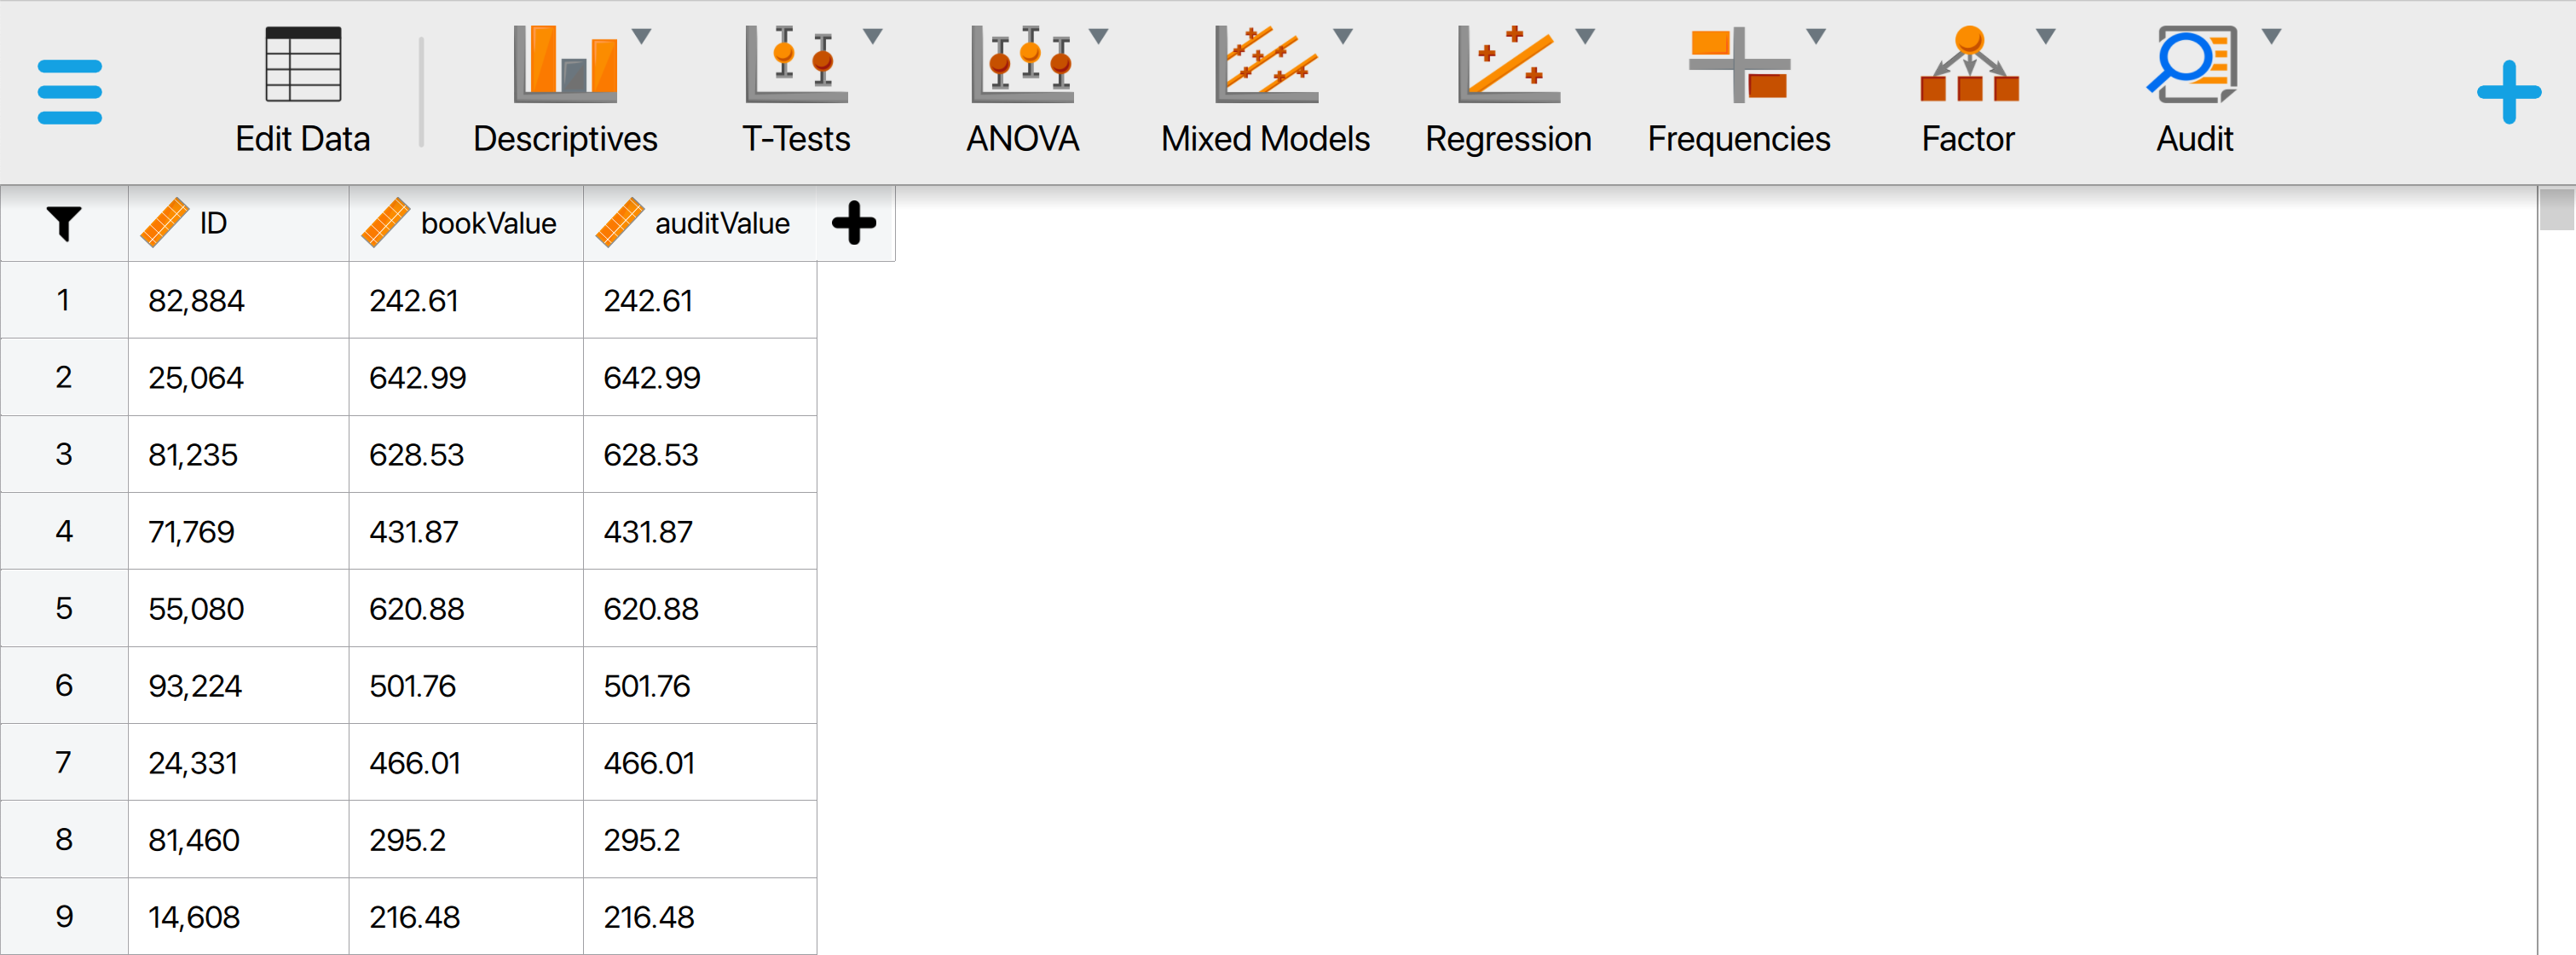
This will open a dataset with 3500 rows and three columns: ‘ID’, ‘bookValue’, and ‘auditValue’. The ‘ID’ column represents the identification number of the items in the population. The ‘bookValue’ column shows the recorded values of the items, while the ‘auditValue’ column displays the true values. The ‘auditValue’ column is included for illustrative purposes, as auditors typically know the true values only for the audited sample, not for all items in the population.
3.2.1 Main settings
In this example, we aim to select a sample of 50 monetary units from the population using monetary unit sampling with a fixed interval. To draw this sample, we open the ‘Selection’ analysis within the Audit module. The interface for the selection analysis is displayed below.
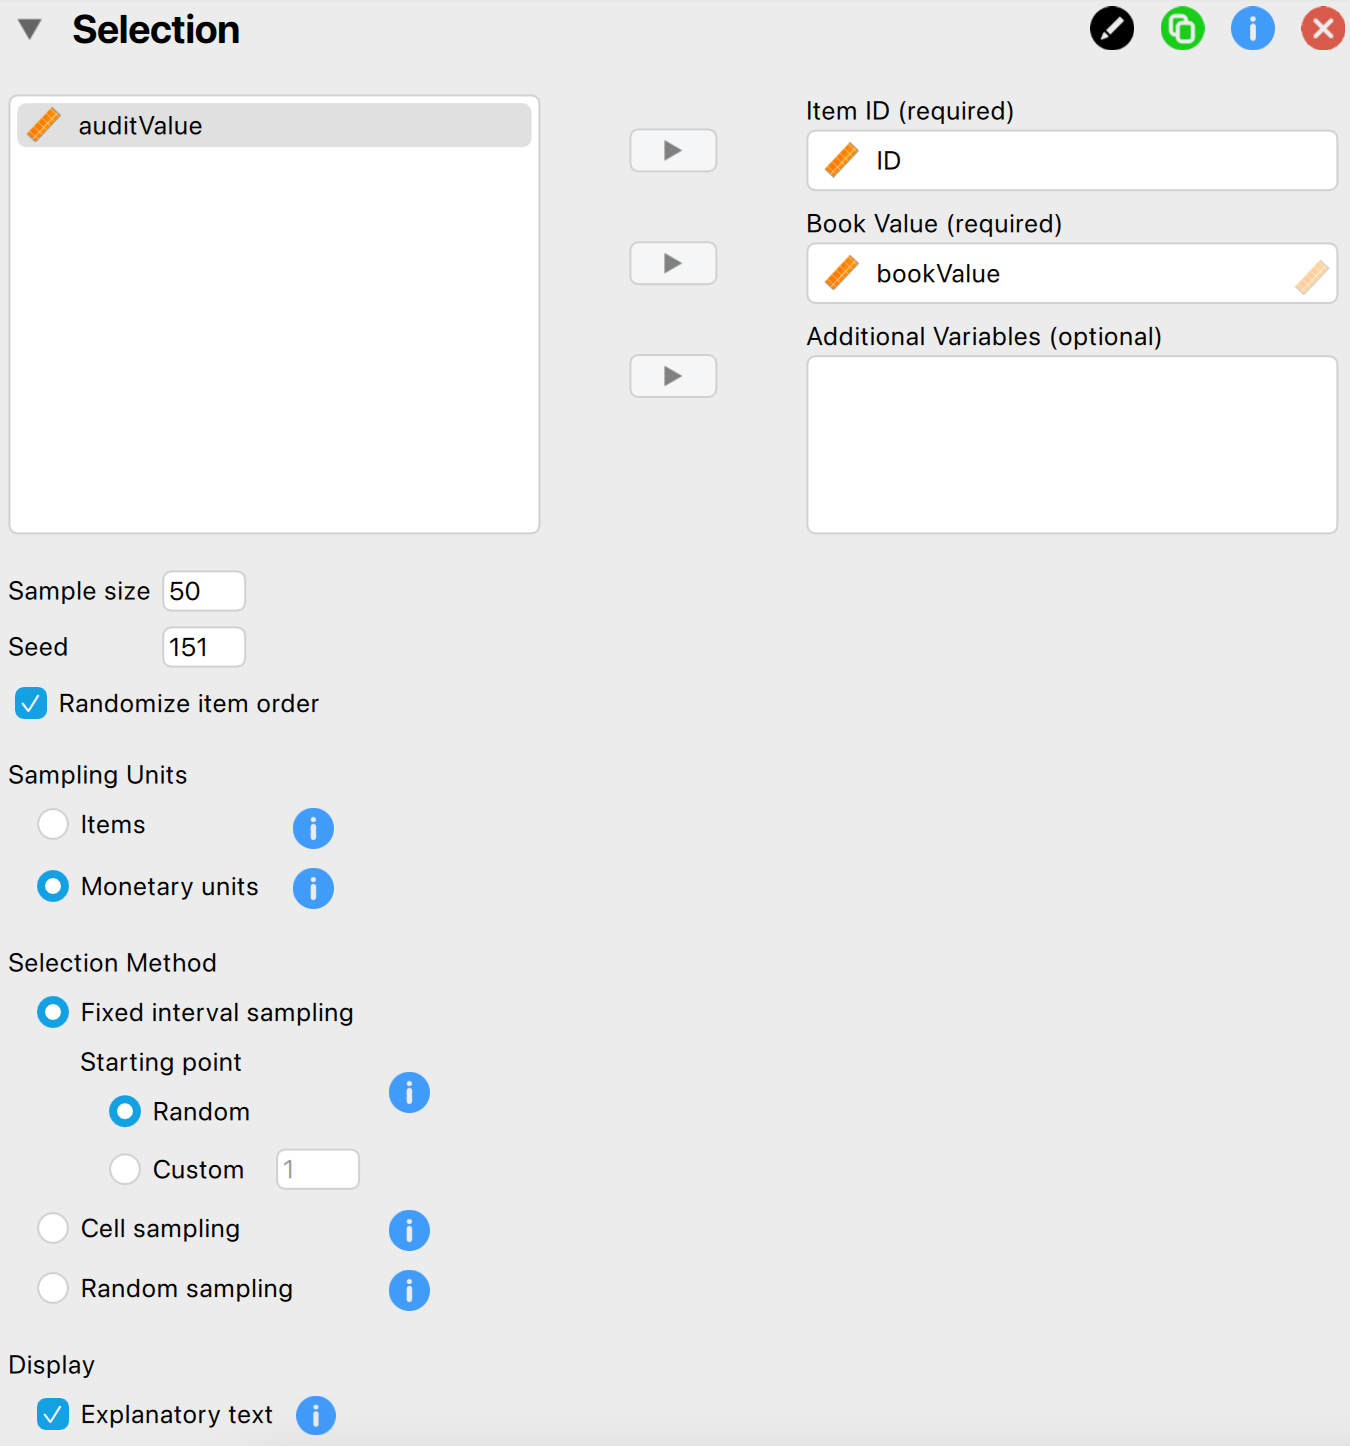
These are the main settings for the analysis:
- Variables: Start by entering the variable that holds the identification numbers for the items into the ‘Item ID’ field. Additionally, since we are performing monetary unit sampling, enter the variable ‘bookValue’ into the ‘Book Value’ field. Any variables you enter into the ‘Additional Variables’ field will be displayed along with the selected items in any output tables.
- Sample size: Specify the number of sampling units you want to select from the population. In this example, we aim to test a sample of 100 monetary units, so we enter the value 50 in this field.
- Seed: A seed in computing is a starting point for generating random numbers. By setting a seed, you ensure that the results of the selection procedure can be reproduced across computers, which is useful for sharing your analysis.
- Randomize item order: Choose whether to randomly shuffle the items in the population before starting the selection process. This can help eliminate any patterns that may exist in the dataset. It’s generally a good idea to use this setting, so we enable it in this example.
- Sampling units: Choose the type of sampling units you want to select. Selecting ‘Items’ will perform attribute sampling, while ‘Monetary units’ will perform monetary unit sampling. Since we have access to book values in this example, we select ‘Monetary units’.
- Selection method: Choose the selection algorithm. Since we want to sample monetary units using a fixed interval, we select ‘Fixed interval sampling’.
- Fixed interval sampling: Starting point: This setting determines the starting point in the first interval. To enhance randomness, we set it to ‘Random’. Alternatively, we could choose a specific starting point by selecting the ‘Custom’ option.
- Display: Explanatory text: Finally, select whether to show explanatory text in the output.
3.2.2 Main output
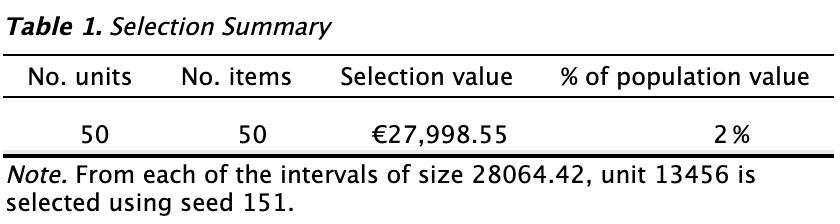
The first main table in the output, shown below, displays the number of selected units and the number of items from which these units were chosen. In this example, 50 sampling units have been selected across 50 items. Additionally, the table shows the total value of the items in the sample and the percentage of the population value that these sample items represent. The 50 items have a total value of €27,998.55, which is 2% of the total population value of €1,403,220.82, as calculated by 27,998.55 / 1,403,220.82 = 0.01995. The note under the table shows that the length of a single interval is €28,064.42.
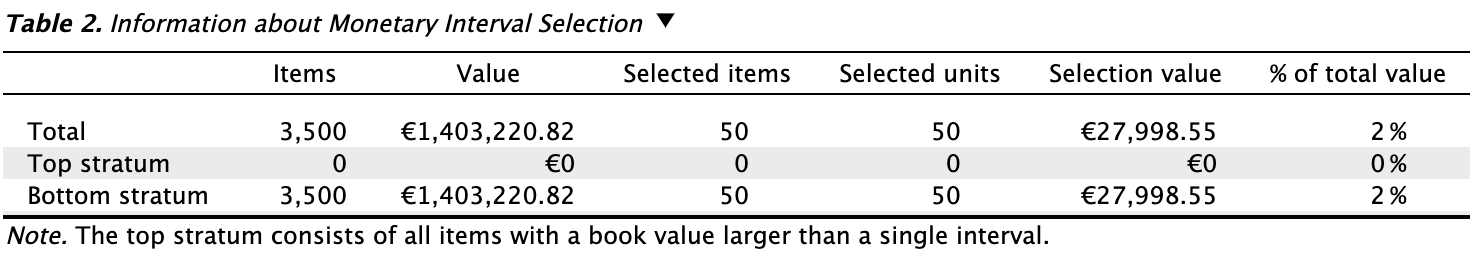
The second main table in the output provides details specific to interval selection methods. It divides the population into two strata: the top stratum, which includes all items with a book value greater than a single interval of €28,064.42 (the top stratum limit would be two interval lenghts for cell sampling), and the bottom stratum, which contains items with a book value smaller than €28,064.42. In this example, there are no items with a book value exceeding €28,064.42, so the top stratum is empty.
3.2.3 Report
The following settings enable you to expand the report with additional output, such as tables and figures.
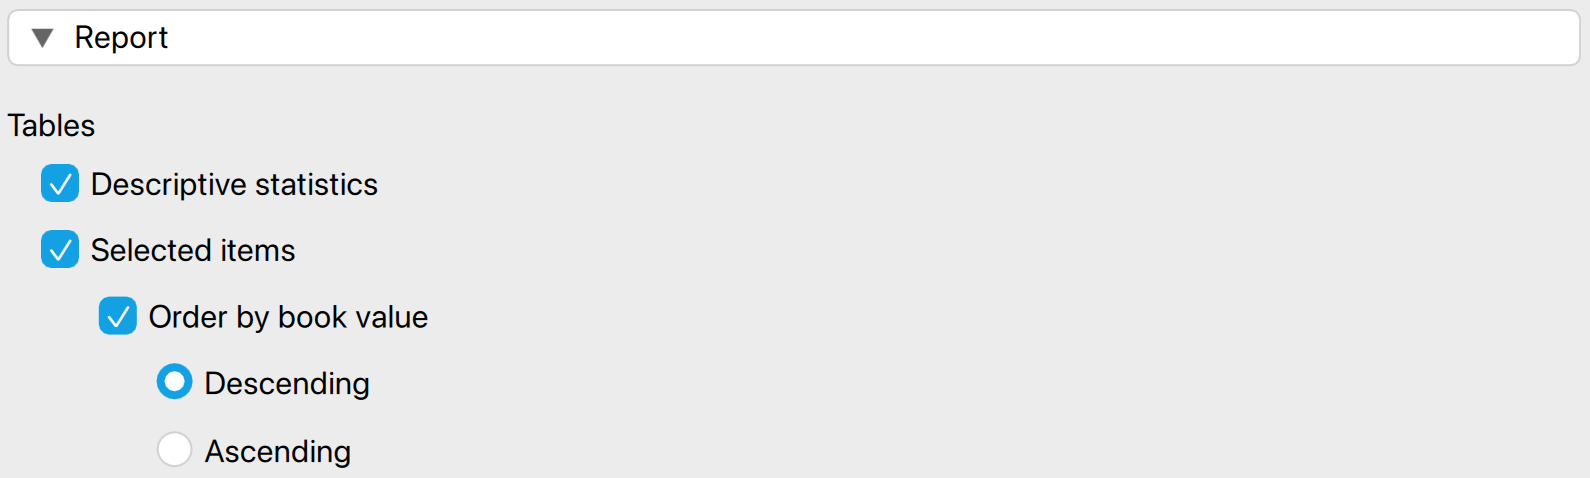
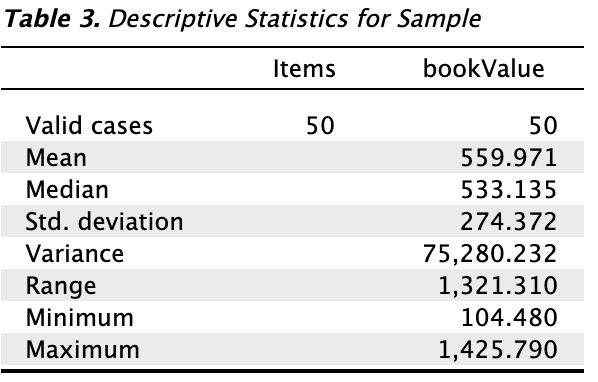
Tables: Descriptive statistics: Checking this box generates a table of descriptive statistics (e.g., mean, median, standard deviation) for the variable in the ‘Book Value’ field and all variables in the ‘Additional Variables’ field. This can be used to gain insights into the distribution and characteristics of the sample.
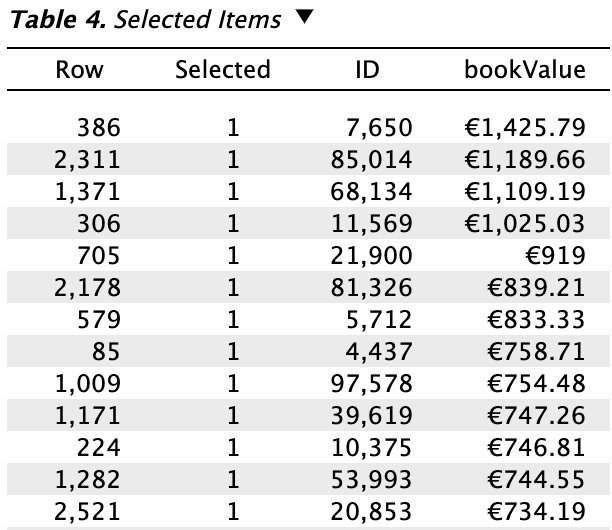
Tables: Selected items: Checking this box generates a table that lists all the selected items in the sample along with their corresponding book values, if this variable is provided.
- Order by book value: This setting enables you to sort the items in the table based on their book value, with the option to arrange them in either ascending or descending order. In this example, we sorted the book values in descending order.
3.2.4 Export
The following settings enable you to isolate and export the selected items to a .csv file.
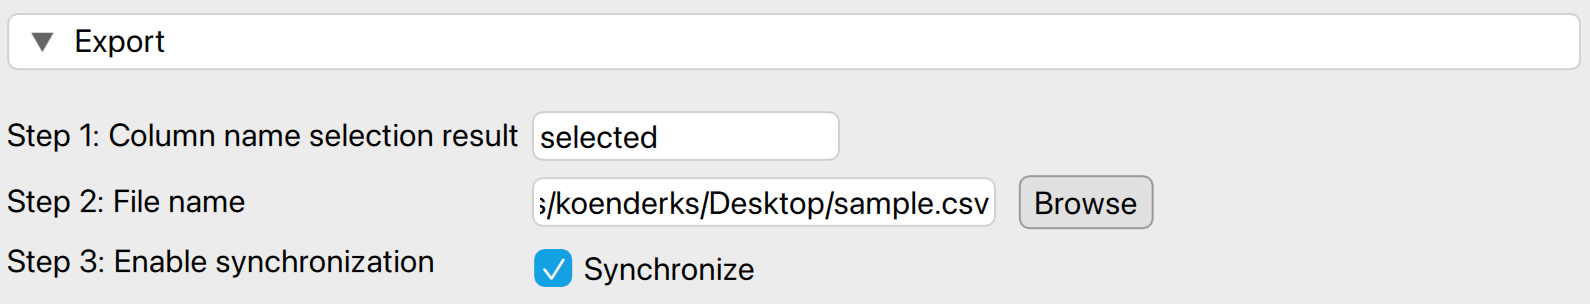
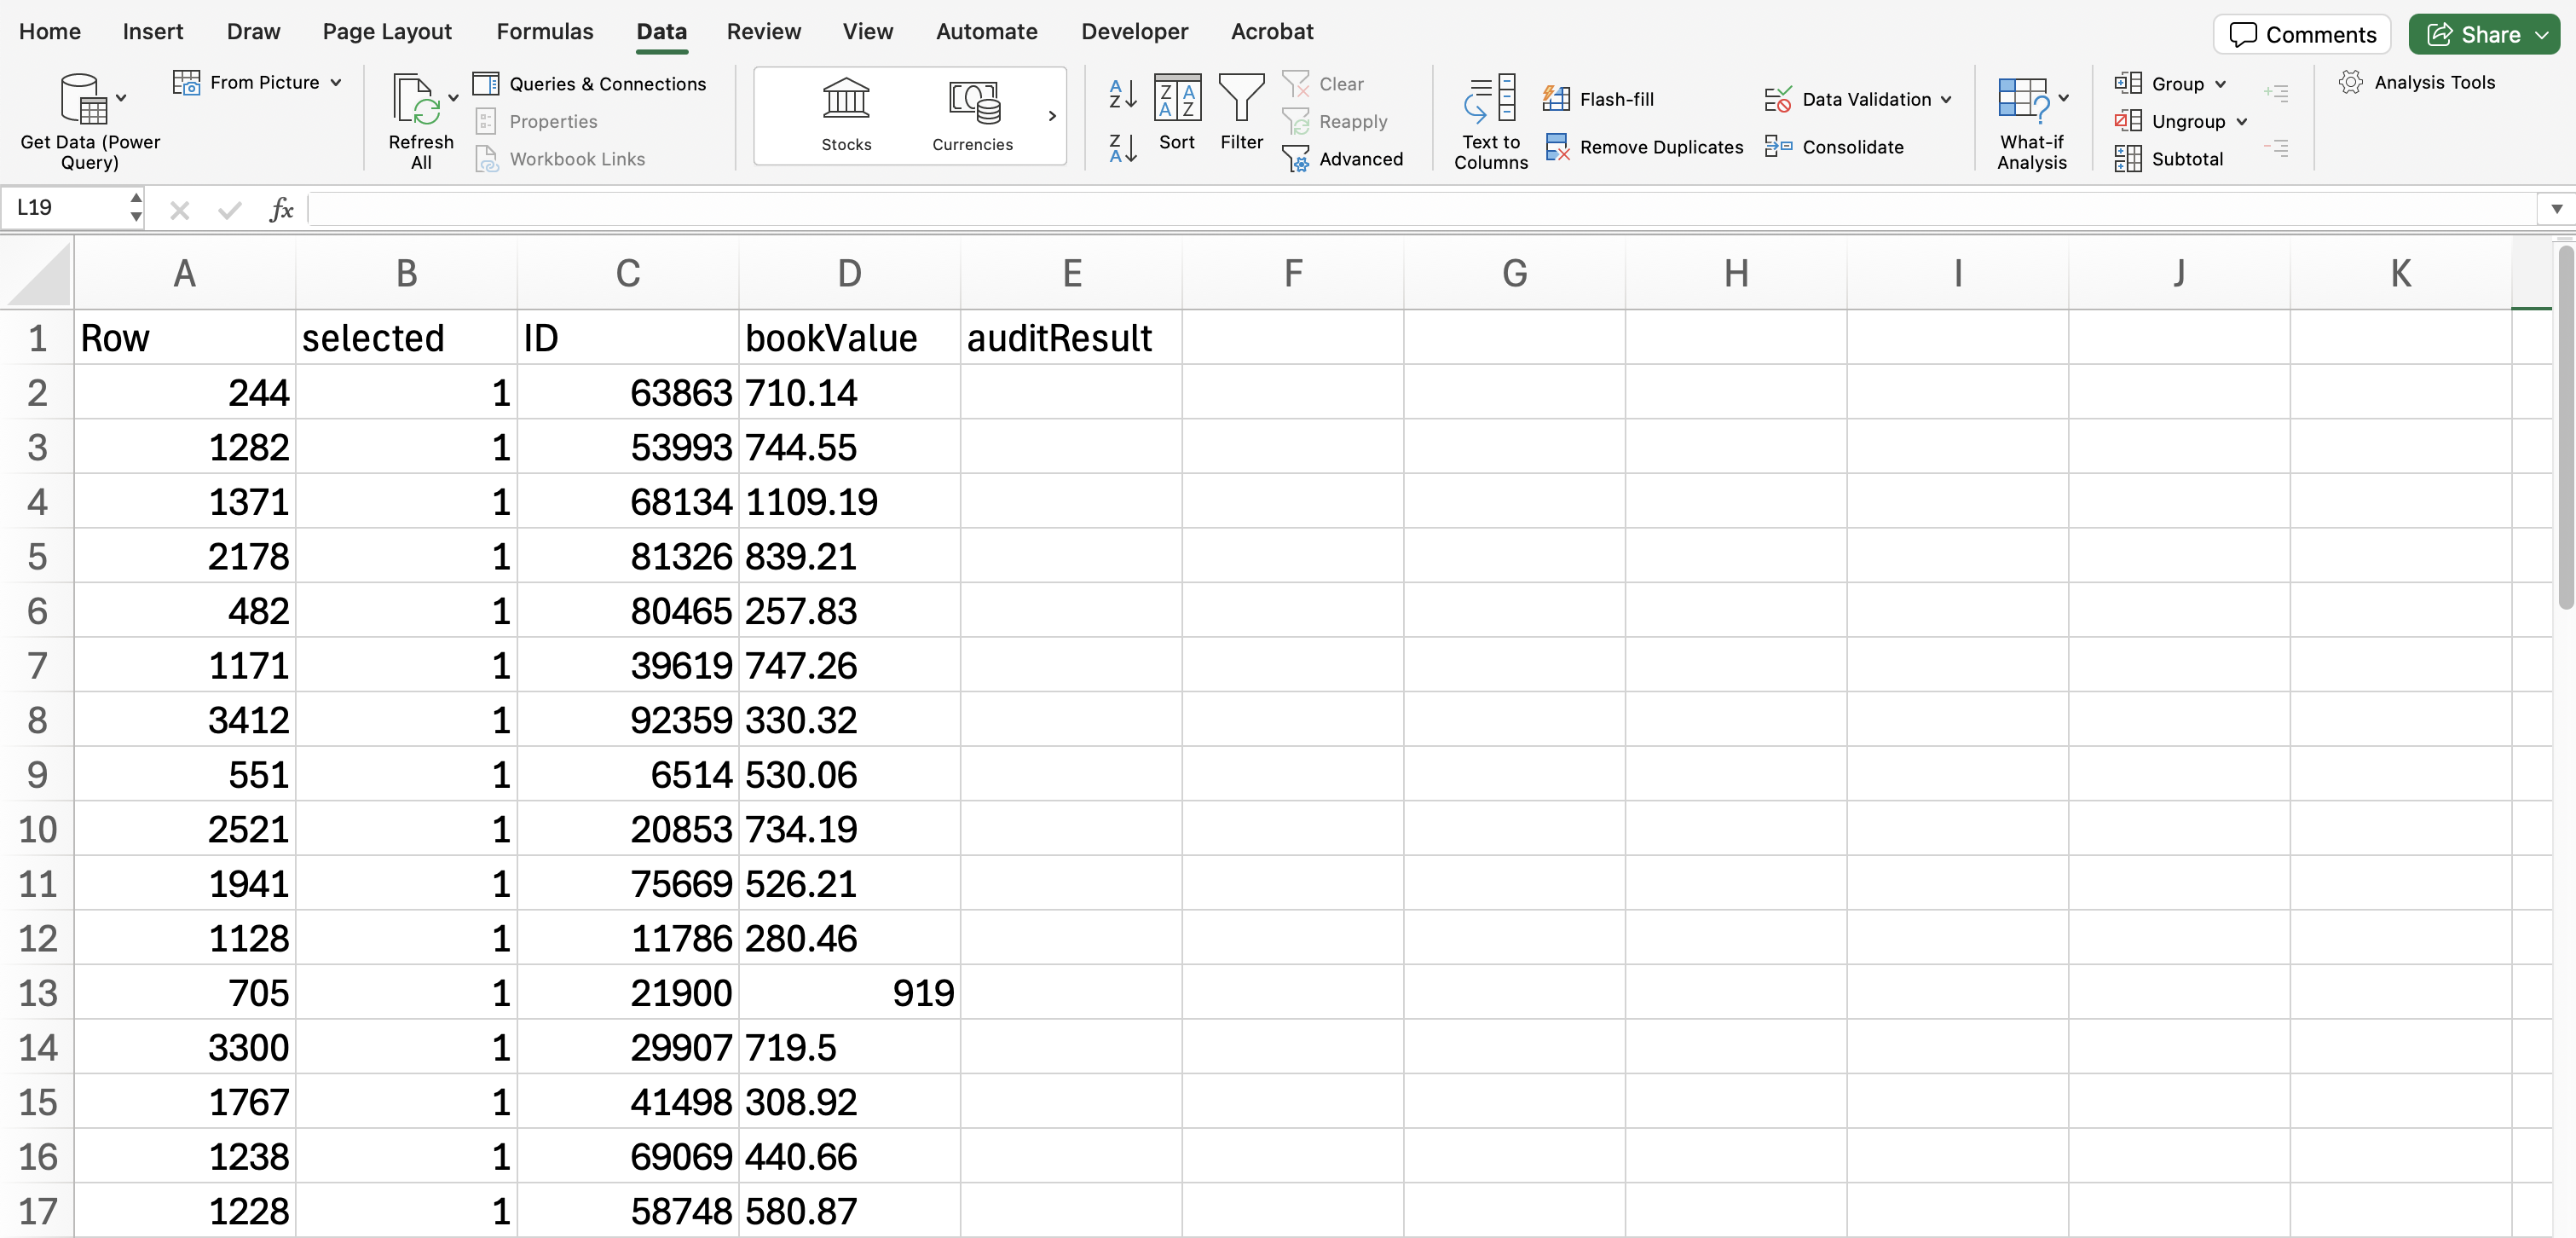
- Column name selection result: Enter the name of the column that will be added to the population file. This column will contain the results of the selection procedure, indicating whether the item is selected for the sample and how many times it is included.
- File name: Click ‘Browse’ to choose a location on your computer where you want to save the sample list.
- Enable synchronization: Finally, click on this setting to create the .csv file on your computer. When this setting is enabled, any changes you make to the sample by adjusting settings in the interface will be immediately reflected in the .csv file. If you prefer not to have this automatic update, uncheck this box after enabling it initially.
After applying these settings, you should find the resulting .csv file saved on your computer.