9 Fairness Workflow
The goal of a statistical fairness audit is to assess whether an algorithm treats unprivileged groups unfairly, based on its outcomes evaluated through a fairness measure. This can be challenging, but the Audit module simplifies the process into two stages: selection and evaluation.
More detailed information about the individual stages in the audit fairness workflow is provided below.
9.1 The two stages in the fairness workflow
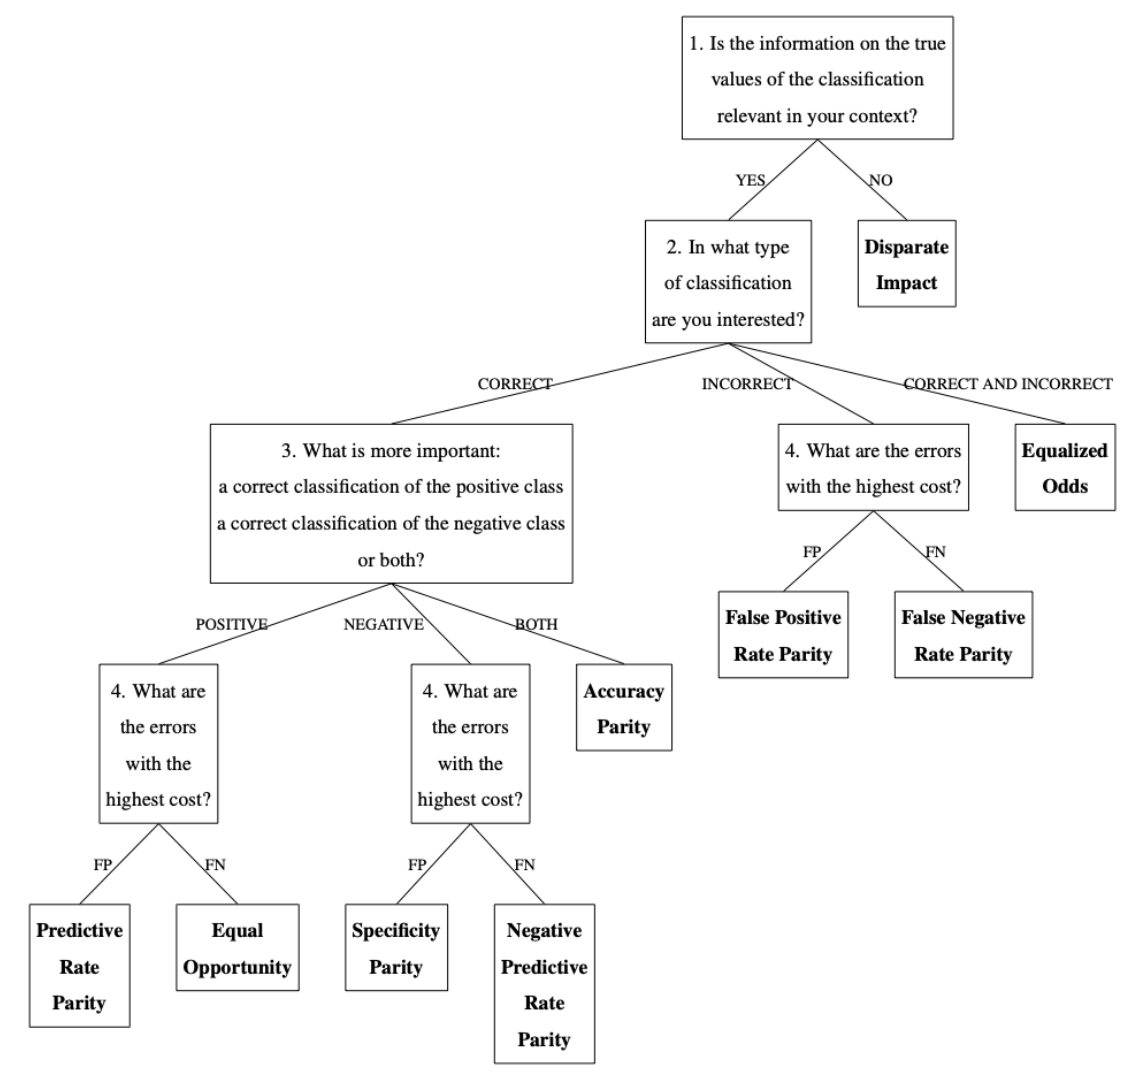
In the selection stage, you choose the most suitable fairness measure to apply to the algorithm’s outcomes you want to audit. This decision is based on the dataset’s characteristics and the audit context. You will answer up to 4 questions, depending on the path taken in the decision-making workflow (see image below).
In the evaluation stage, you apply the selected fairness measure to assess the algorithm’s outcomes. Statistical techniques calculate the values of the evaluation metric on which the fairness measure is based, and then test whether differences across groups indicate unfairness.
This manual emphasizes the practical application of the fairness workflow in JASP.
9.2 Practical example
The Audit module in JASP offers two ways to navigate the fairness workflow: the Fairness Workflow analysis, which guides you through all two stages, and an individual analysis for the Evaluation. This chapter uses the fairness workflow analysis to explain the Audit module’s core functionality.
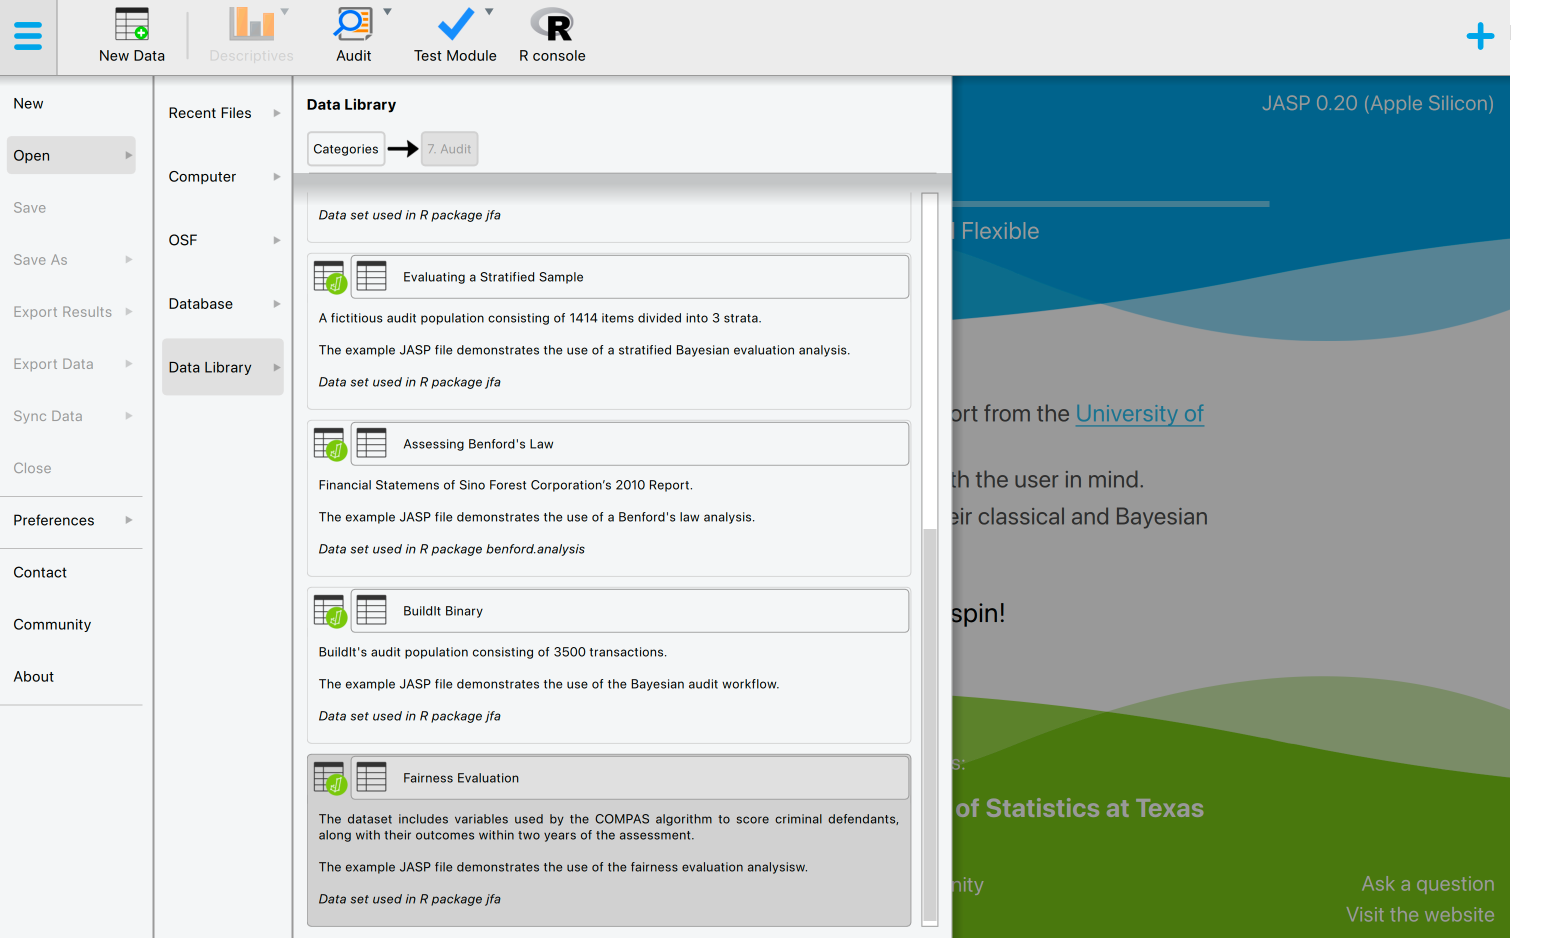
Let’s explore an example of the audit fairness workflow. To follow along, open the ‘Fairness Evaluation’ dataset from the Data Library. Navigate to the top-left menu, click ‘Open’, then ‘Data Library’, select ‘7. Audit’, and finally click on the text ‘Fairness Evaluation’ (not the green JASP-icon button).
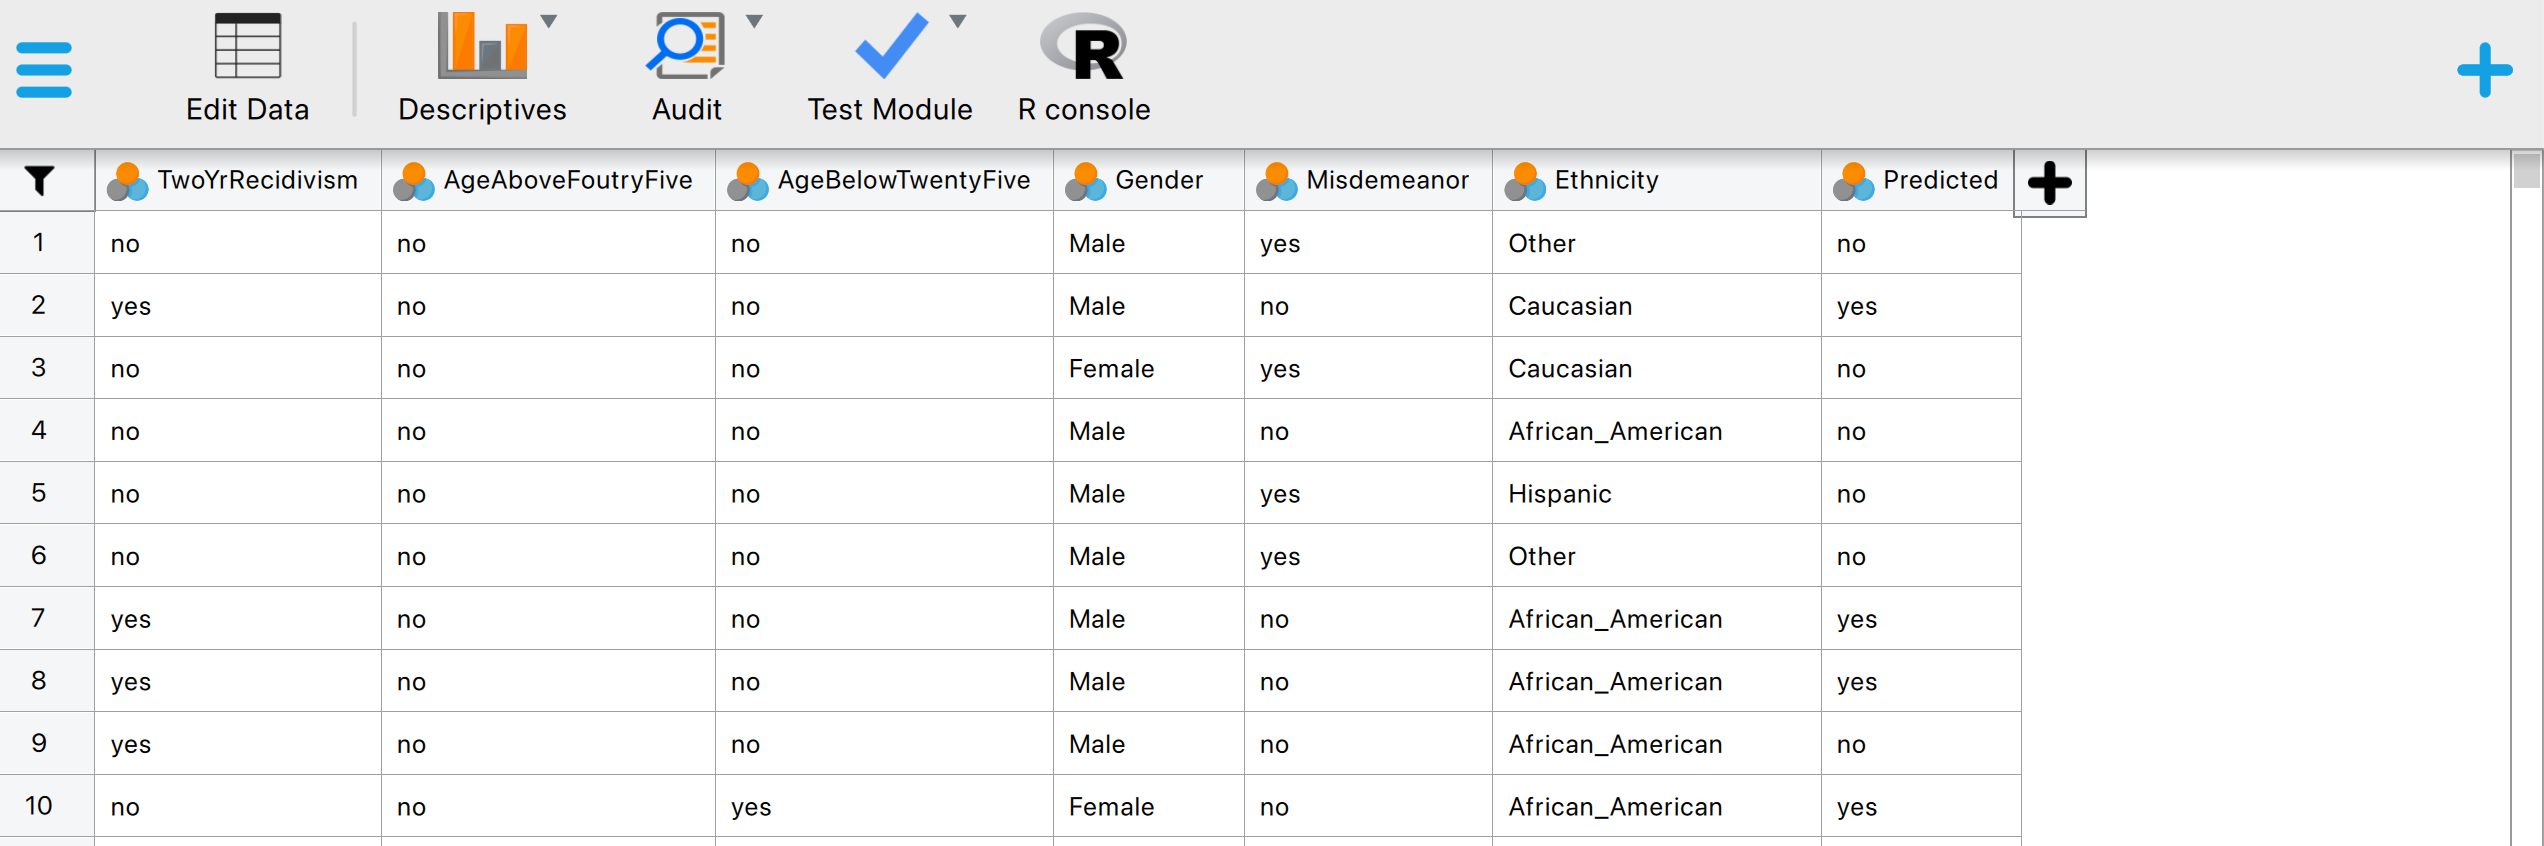
This will open a dataset with 6,172 rows and seven columns. The ‘TwoYrRecidivism’ column indicates whether the offender committed a crime within two years of being released and, therefore, provides the ground truth information on the offenders’ recidivism. The ‘Predicted’ column indicates whether the COMPAS algorithm classifies the offender as low or high risk of committing another crime after being released. The ‘Ethnicity’ column indicates the offender’s ethnicity (African-American, Asian, Caucasian, Hispanic, Native American, or Other). This column represents the so-called senstitive attribute. In this example, we seek to determine, with 95% confidence, whether the COMPAS algorithm discriminates against offenders based on their ethnicity.
9.2.1 Stage 1: Selection
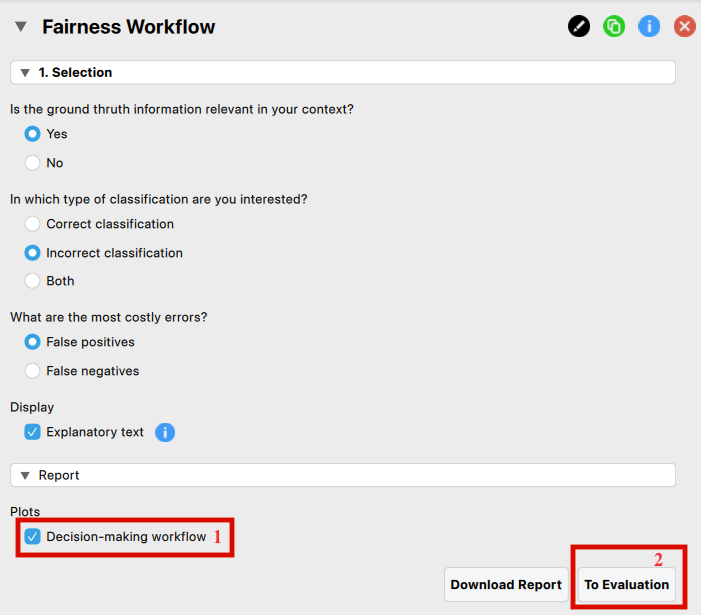
To start the fairness workflow, click on the Audit module icon and select ‘Fairness Workflow’. This will open the following interface. where you need to specify the settings for the analysis.
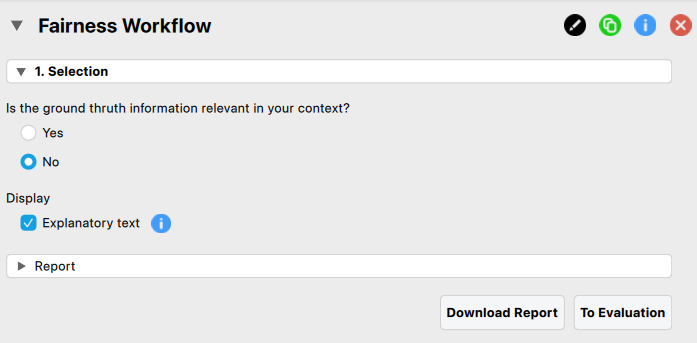
As you change the default answer to this first question (answer ‘no’), the next question appears. This happens for each question in the decision-making workflow.
In this example, the following answers are provided to the input questions, and the following specific options are then selected to generate both a textual and graphical output.
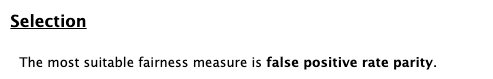
The primary output from the selection stage, shown below, identifies false positive rate parity as the most suitable measure for evaluating the fairness of the algorithm’s outcomes.
- Decision-making workflow: By selecting this option, you will see a graphical representation of the decision path: the questions you answered are shown in white, while the questions and answers that were skipped (because not relevant to your path) are shown in grey.

- Next stage: Next, progress to the evaluation stage by clicking the ‘To Evaluation’ button.
9.2.2 Stage 2: Evaluation
In the evaluation stage, you assess the fairness in the algorithm’s outcome (the ‘Predicted’ column in the dataset).
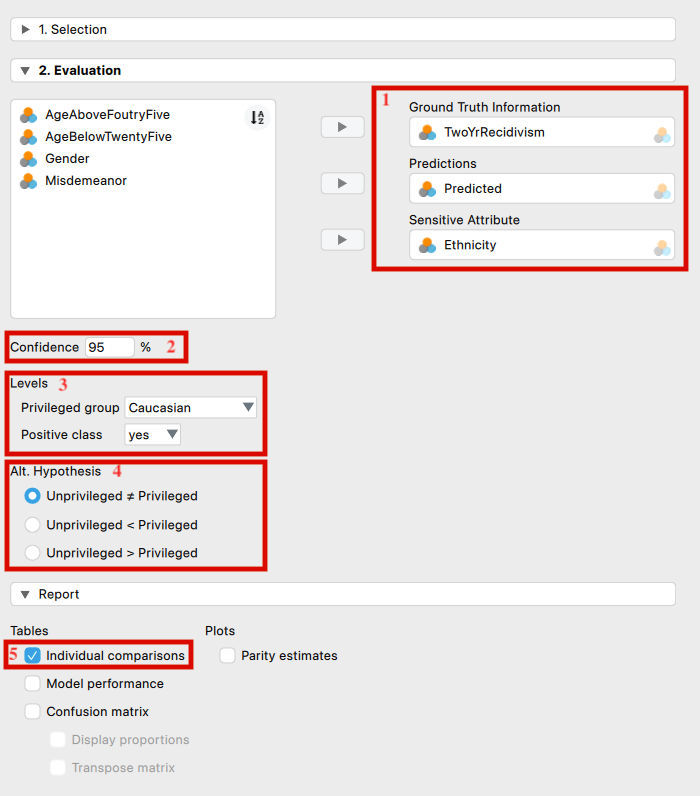
The following settings are required:
Indicate the variables: First, enter the variable indicating the true recidivism values of the offenders into the ‘Ground Truth Information’ field. Then, input the variables that hold the predicted recidivism values (the algorithm’s outcome to be audited) and the offenders’ ethnicity into their respective fields.
Confidence level: Specify the confidence level for your analysis. This level, which complements the significance level, dictates when to reject the null hypothesis and the amount of work needed to approve the fairness of the algorithm.
Levels: Select which group, identified by the sensitive attribute’s values, is the privileged one (i.e., which group is advantaged by the algorithm’s outcome), and which class of the algorithm’s predictions is the favorable outcome.
Alt. Hypothesis: Choose whether to calculate a two-sided test or a one-sided test to evaluate the algorithm’s fairness.
Individual comparisons: In the case of multiple unprivileged groups, it is possible to identify which specific group is being discriminated against if the algorithm is found to be unfair toward at least one group.
For a more detailed explanation of the settings and output in the evaluation stage, see Chapter 10.
The primary output from the evaluation stage, as shown in the first table below, reveals that the false positive rates across the groups—comparing all unprivileged groups to the privileged one—are not equal. Therefore, the algorithm is unfair toward at least one unprivileged group.The second table provides details on which specific group, among all the unprivileged groups, is being discriminated against. This is determined by comparing the algorithm’s outcomes for each unprivileged group with those for the privileged group. A group is considered discriminated against if the p-value for its corresponding row is below 0.05.
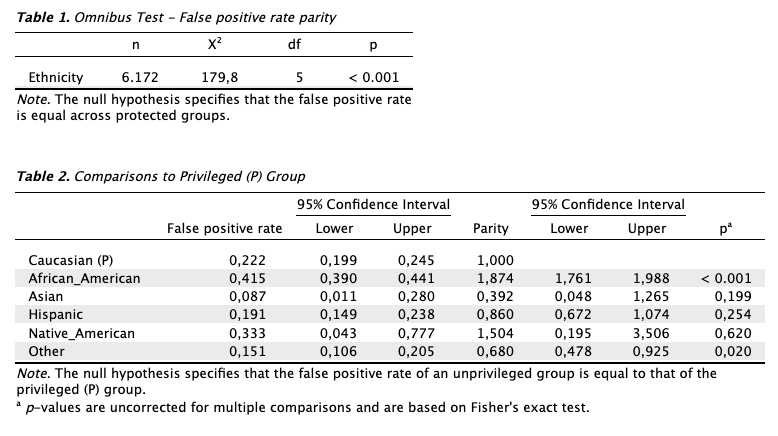
Based on the results of this statistical analysis, the auditor concludes that the algorithm is unfair toward at least one group (Table 1). By comparing each group to the designated privileged group (Caucasian offenders) (Table 2), the auditor further concludes that the algorithm is unfair toward African-American offenders and those classified with ‘Other’ as their ethnicity.