5 True Value Estimation
This chapter is about the ‘True Value Estimation’ analysis in the ‘Audit Sampling’ section of the module.
5.1 Purpose of the analysis
The objective of the true value estimation analysis is to estimate the true value of the population based on a sample. This procedure is commonly used when an audit sample contains many misstatements. In such cases, the auditor cannot conclude that the population is free of material misstatement but aims to estimate its true value. The estimation procedures in this analysis assume a minimum of 30 misstatements in the sample.
5.2 Practical example
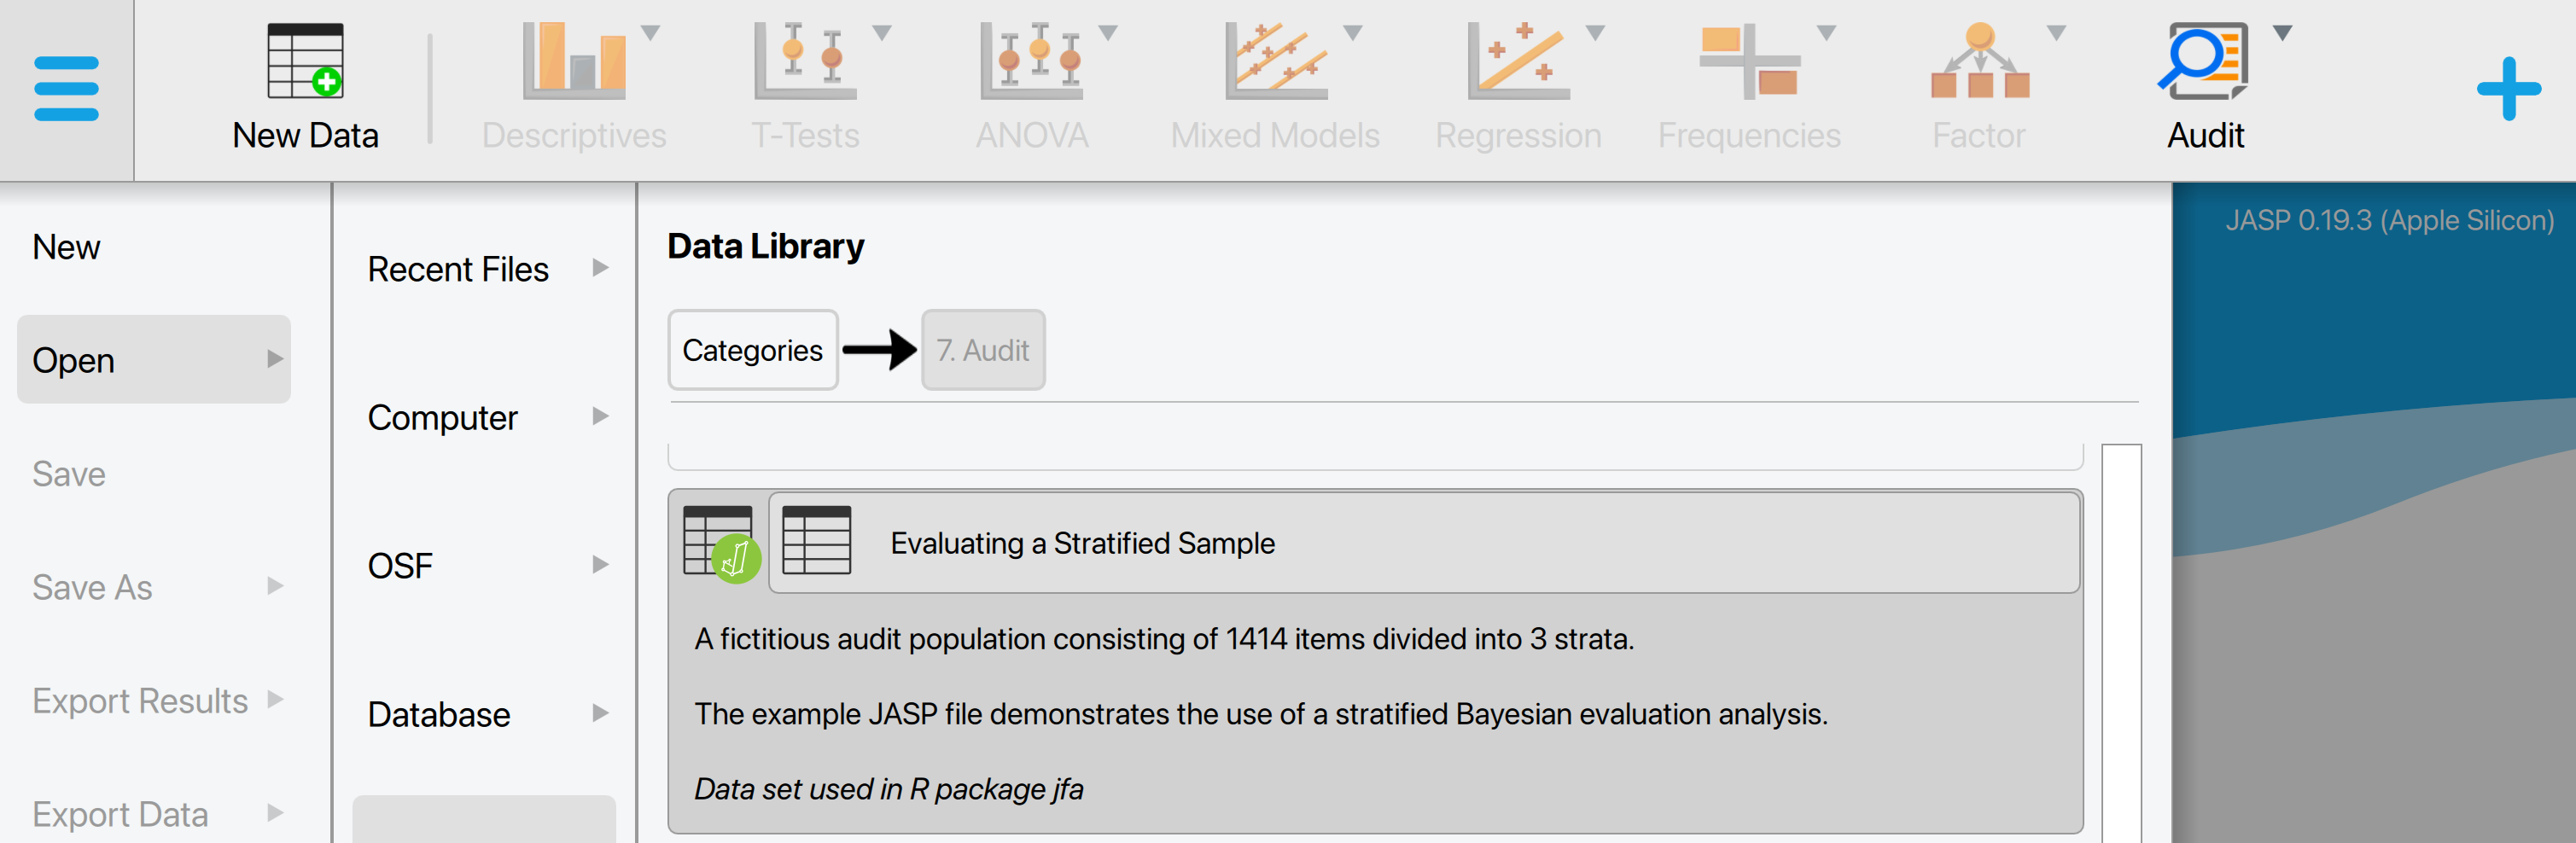
Let’s explore an example analysis of a true value estimation analysis. To follow along, open the ‘Evaluating a Stratified Sample’ dataset from the Data Library. Navigate to the top-left menu, click ‘Open’, then ‘Data Library’, select ‘7. Audit’, and finally click on the text ‘Evaluating a Stratified Sample’ (not the green JASP-icon button).
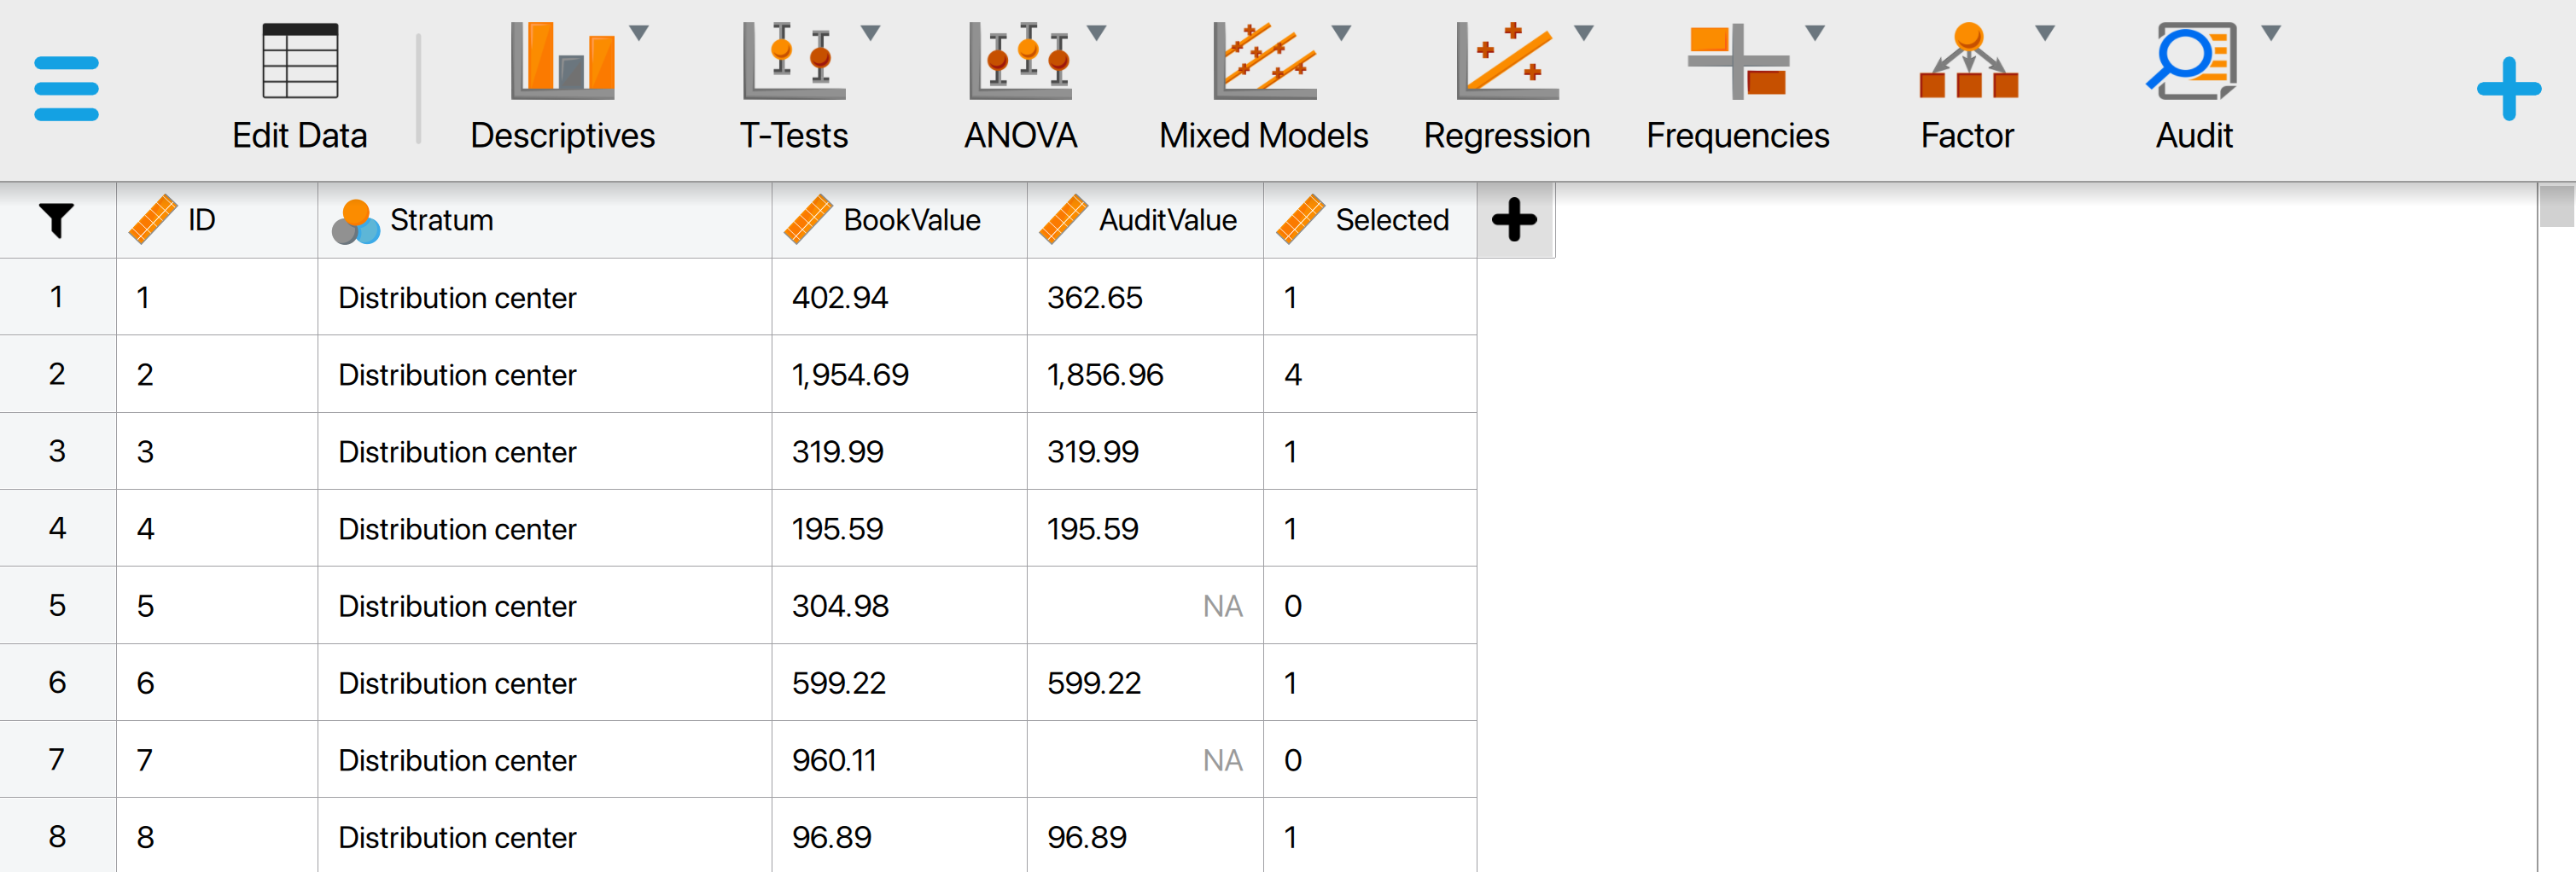
This will open a dataset with 1414 rows and five columns: ‘ID’, ‘Stratum’, ‘BookValue’, ‘AuditValue’, and ‘Selected’, which represents a population. The ‘ID’ column represents the identification number of the items in the population. The ‘Stratum’ column shows the location from which the item was retrieved. The ‘BookValue’ and ‘AuditValue’ columns show the recorded and true values of the items, respectively. Finally, the ‘Selected’ column shows which items were selected to be included in the sample. The total value of the population (i.e., the sum of the ‘BookValue’ column) is €4,254,246,09. Note that the audit values of all items that were not selected in the sample (the value of ‘Selected’ is 0) are empty (NA).
5.2.1 Main settings
In this example, we want to estimate the true value of the population based on the audite sample. To do this, we open the ‘True Value Estimation’ analysis within the Audit module. The interface for this analysis is displayed below.
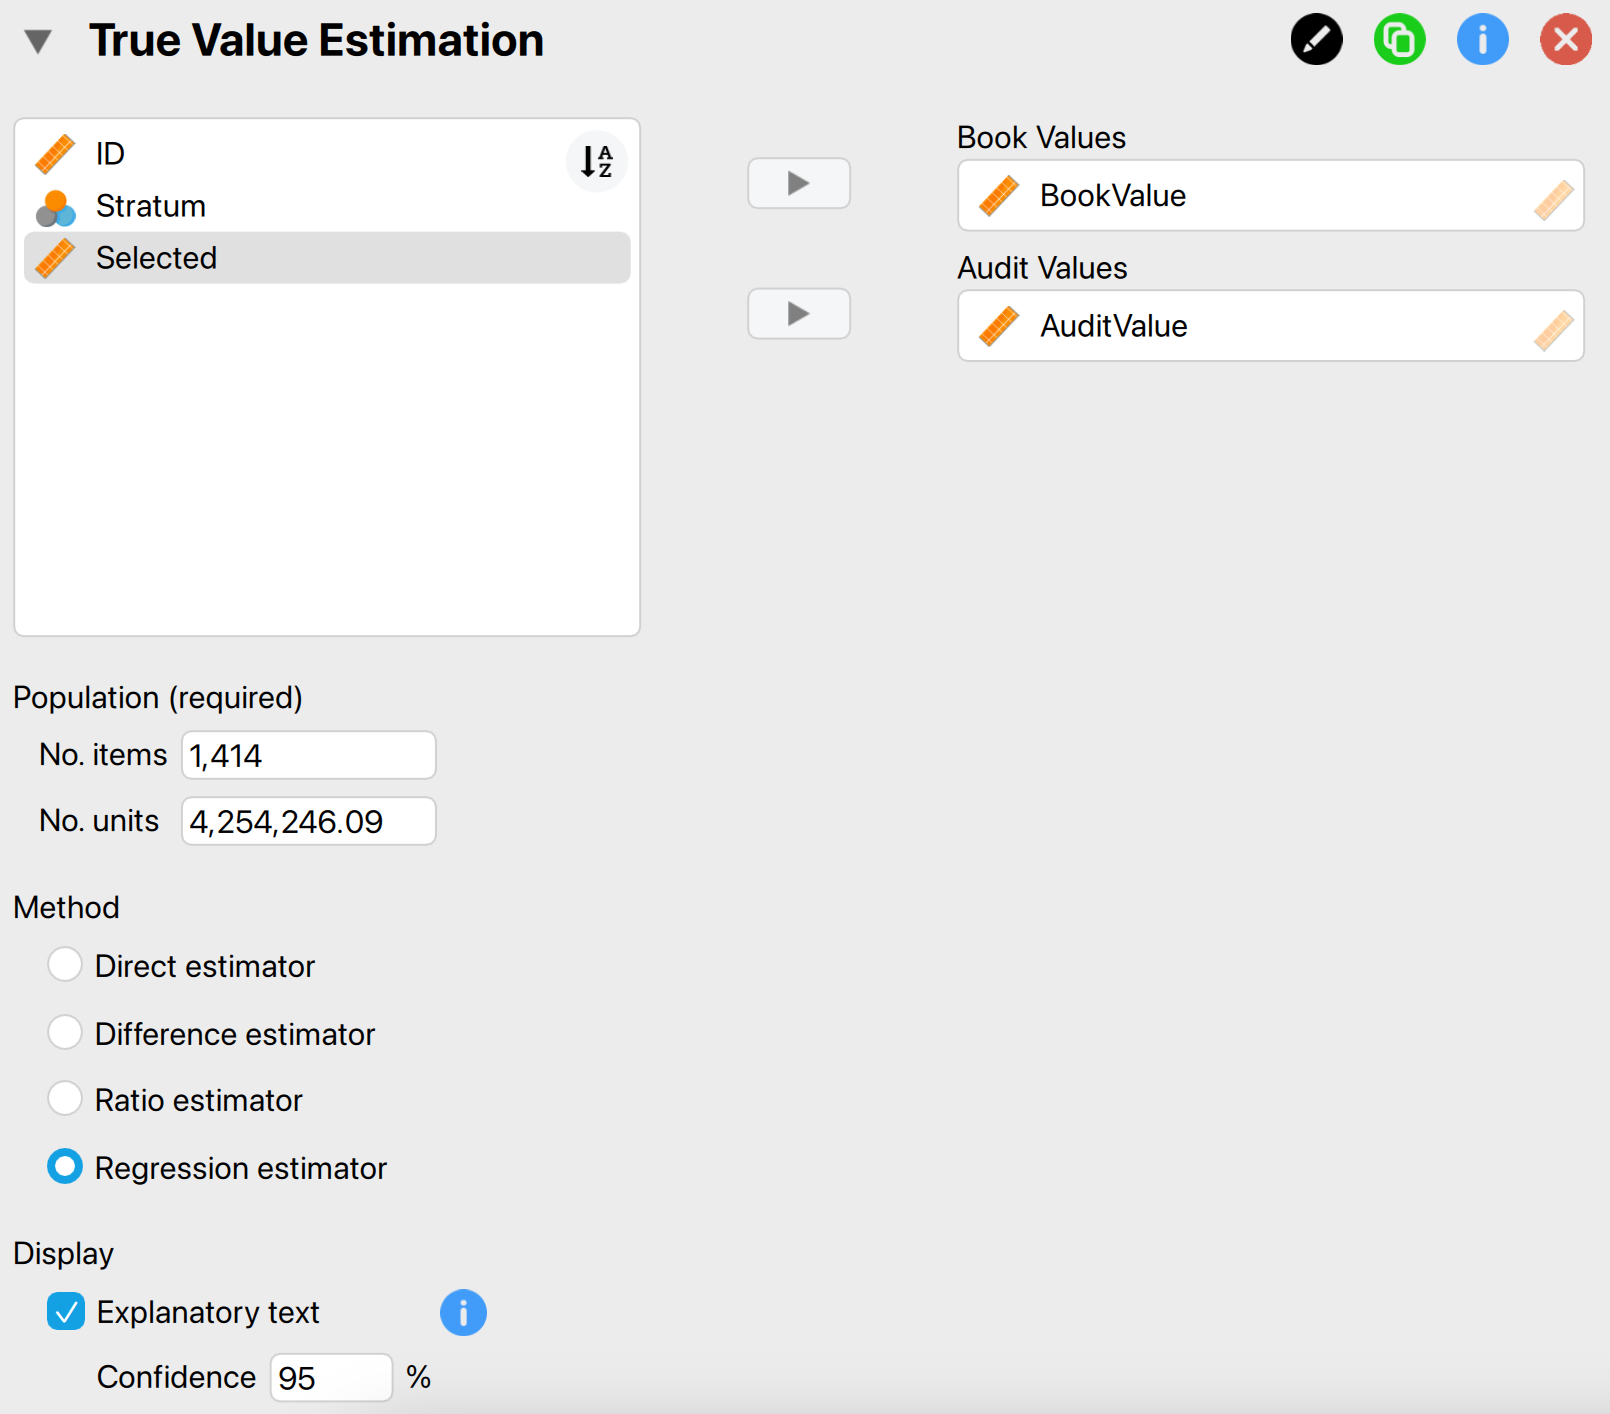
These are the main settings for the analysis:
- Variables: First, enter the variables indicating the book values and audit (i.e., true) values of the sample items in the corresponding box.
- Population: No. items: Enter the number of items in the population. In this example, the population consists of 1,414 items, so we input the value 1,414 here.
- Population: No. units: Enter the total value of the population. In this example, the population has a total value of €4,254,246.09, so we input the value 4,254,246.09 here.
- Method: Select the statistical method for estimating the true value (Touw & Hoogduin, 2012). The regression estimator is typically the most accurate method, so we choose this method here.
- Display: Explanatory text: Finally, select whether to show explanatory text in the output.
- Display: Confidence: Set the confidence level used in the explanatory text. In this example, we use a confidence level of 95%.
5.2.2 Main output
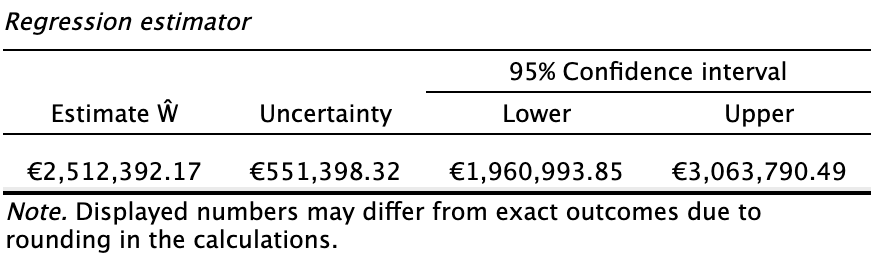
The main table in the output below presents the point estimate for the true population value, along with the uncertainty of the estimate and its 95% confidence interval. In this example, the true value of the population is estimated to be €2,512,392.17, with an uncertainty of €551,398.32. Therefore, we can be 95% confident that the true value of the population lies between €1,960,993.85 and €3,063,790.49. The confidence interval does not include the recorded population value of €4,254,246.09.
5.2.3 Report
The following settings enable you to expand the report with additional output, such as tables and figures.
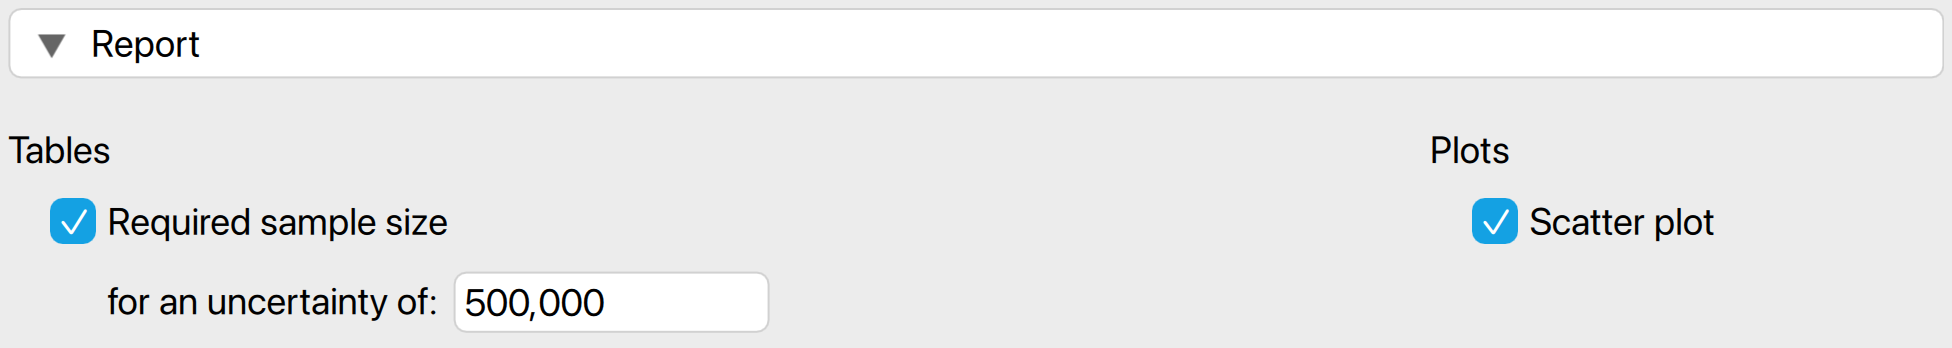
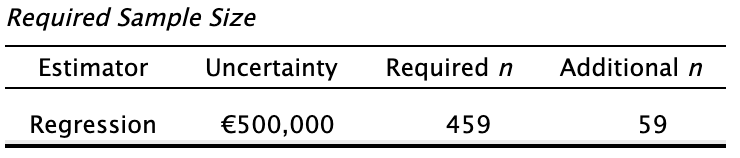
Tables: Required sample size: Checking this box calculates the required sample size to achieve a specific level of uncertainty in the estimate. For example, the current uncertainty in the estimate is €551,398.32. The table below indicates that to reduce this uncertainty to €500,000, a total sample of 459 items is needed. Since we have already sampled 400 items, only 59 additional samples are required.
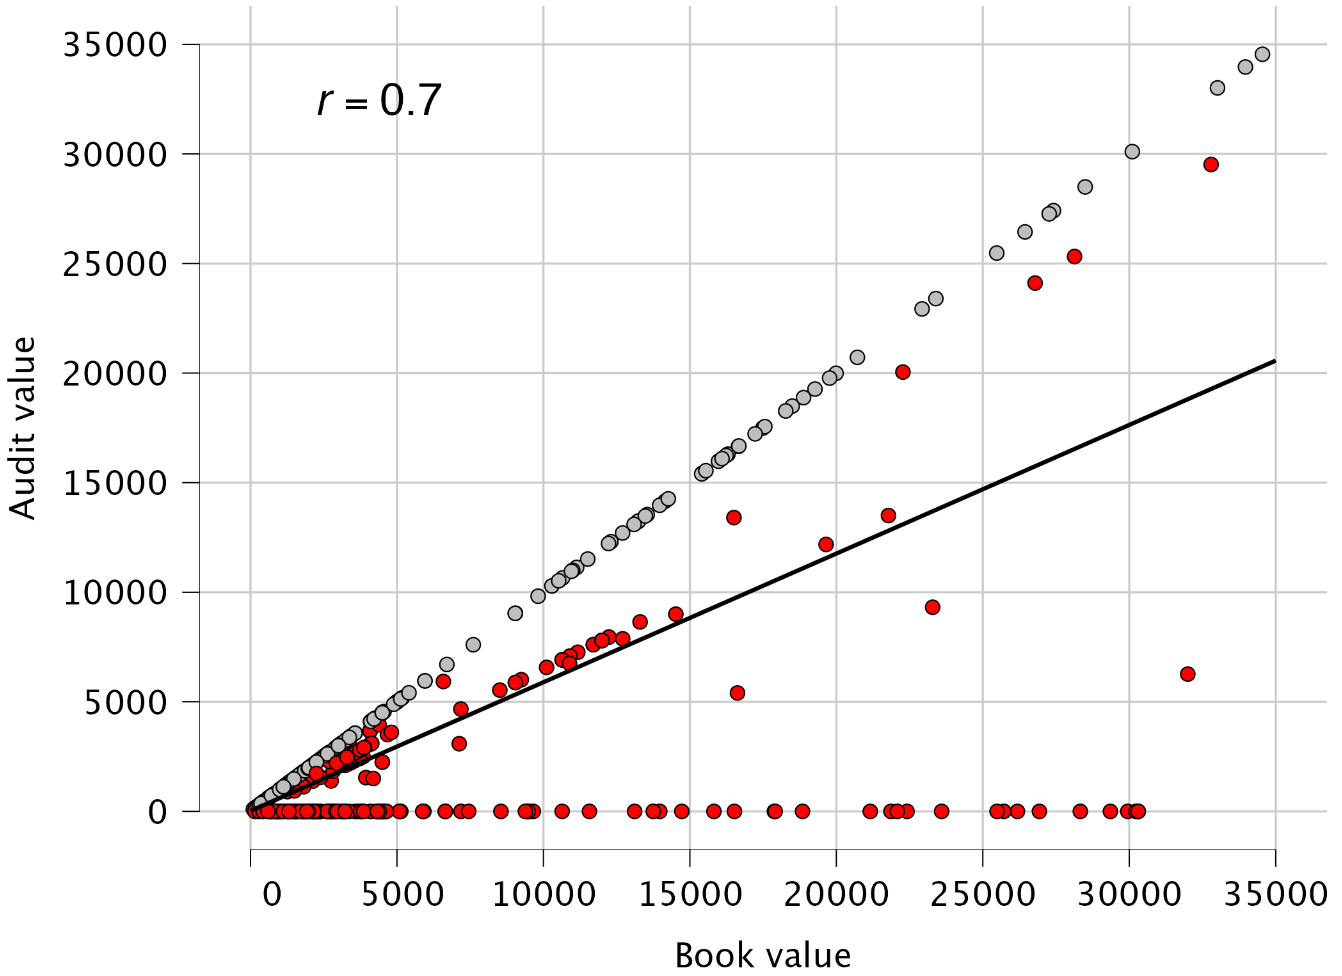
Plots: Scatter plot: Checking this box generates a figure that compares the book values of the items in the sample against their true values. Points on the diagonal, shown in gray, represent items where the book value matches the true value. Points in red indicate items where the book value does not match the true value. The black line represents the Pearson correlation between the book values and audit values, which in this case is r = 0.7.