Algorithm auditing: Get started
Koen Derks
Source:vignettes/articles/algorithm-auditing.Rmd
algorithm-auditing.RmdIntroduction
Welcome to the ‘Algorithm auditing’ vignette of the jfa package. This page provides a guide to the functions in the package that are designed to facilitate the audit of algorithms and predictive models. In particular, these functions implement techniques for determining an appropriate fairness measure and subsequently calculating and testing algorithmic fairness using this measure. The package also allows users to specify a prior probability distribution to conduct Bayesian algorithm auditing using these functions.
Functions and intended usage
Below you can find an explanation of the available algorithm auditing functions in jfa.
Selecting a fairness measure
The fairness_selection() function is designed to help
auditors to select the appropriate fairness metric to perform algorithm
auditing. The questions within the decision-making workflow are based on
observable data characteristics, the properties of fairness measures and
the information required for their calculation. However, these questions
are posed to the user in an easily understandable manner, requiring no
statistical background or in-depth knowledge of the fairness measures.
The function returns an object that can be used with associated
print() and plot() methods.
For additional details about this function, please refer to the function documentation on the package website.
Example usage:
# Workflow leading to predictive rate parity
fairness_selection(q1 = 1, q2 = 1, q3 = 1, q4 = 1)
##
## Fairness Measure for Model Evaluation
##
## Selected fairness measure: Predictive Rate Parity
##
## Based on:
## Answer to question 1 (q1): Yes (1)
## Answer to question 2 (q2): Correct classification (1)
## Answer to question 3 (q3): Correct classification of the positive class (1)
## Answer to question 4 (q4): False Positive (1)Testing algorithmic fairness
The model_fairness() function is designed to evaluate
fairness in algorithmic decision-making systems. It does this by
computing and testing the equality of various model-agnostic fairness
metrics between protected classes, based on a set of true labels and the
predictions of an algorithm. The ratio of these metrics between an
unprivileged protected class and a privileged protected class is
referred to as parity, which quantifies relative fairness in the
algorithm’s predictions. Available parity metrics include predictive
rate parity, proportional parity, accuracy parity, false negative rate
parity, false positive rate parity, true positive rate parity, negative
predictive value parity, specificity parity, and demographic parity
(Friedler et al., 2019; Pessach & Shmueli,
2022). The function returns an object that can be used with the
associated summary() and plot() methods.
For additional details about this function, please refer to the function documentation on the package website.
Example usage:
# Compare predictive rate parity
x <- model_fairness(
  data = compas,
  protected = "Ethnicity",
  target = "TwoYrRecidivism",
  predictions = "Predicted",
  privileged = "Caucasian",
  positive = "yes",
  metric = "prp"
)
summary(x)
##
## Classical Algorithmic Fairness Test Summary
##
## Options:
## Confidence level: 0.95
## Fairness metric: Predictive rate parity
## Model type: Binary classification
## Privileged group: Caucasian
## Positive class: yes
##
## Data:
## Sample size: 6172
## Unprivileged groups: 5
##
## Results:
## X-squared: 18.799
## Degrees of freedom: 5
## p-value: 0.0020951
##
## Comparisons to privileged (P) group:
## Precision Parity
## Caucasian (P) 0.57738 [0.53902, 0.61506] -
## African_American 0.66525 [0.6434, 0.68658] 1.1522 [1.1143, 1.1891]
## Asian 0.5 [0.067586, 0.93241] 0.86598 [0.11706, 1.6149]
## Hispanic 0.5906 [0.50715, 0.67038] 1.0229 [0.87836, 1.1611]
## Native_American 0.6 [0.14663, 0.94726] 1.0392 [0.25396, 1.6406]
## Other 0.61176 [0.49988, 0.71562] 1.0596 [0.86578, 1.2394]
## Odds ratio p-value
## Caucasian (P) - -
## African_American 1.4543 [1.2087, 1.7491] 5.4523e-05
## Asian 0.73231 [0.052801, 10.156] 1
## Hispanic 1.0559 [0.72564, 1.5432] 0.78393
## Native_American 1.0978 [0.1249, 13.228] 1
## Other 1.1532 [0.7105, 1.8933] 0.5621
##
## Model performance:
## Support Accuracy Precision Recall F1 score
## Caucasian 2103 0.6585830 0.5773810 0.4720195 0.5194110
## African_American 3175 0.6724409 0.6652475 0.7525587 0.7062147
## Asian 31 0.7419355 0.5000000 0.2500000 0.3333333
## Hispanic 509 0.6817289 0.5906040 0.4656085 0.5207101
## Native_American 11 0.6363636 0.6000000 0.6000000 0.6000000
## Other 343 0.6938776 0.6117647 0.4193548 0.4976077Benchmarks
To ensure the accuracy of statistical results, jfa employs automated unit tests that regularly validate the output from the package against the following established benchmarks in the area of algorithm auditing:
- fairness (R package version 1.2.2)
Cheat sheet
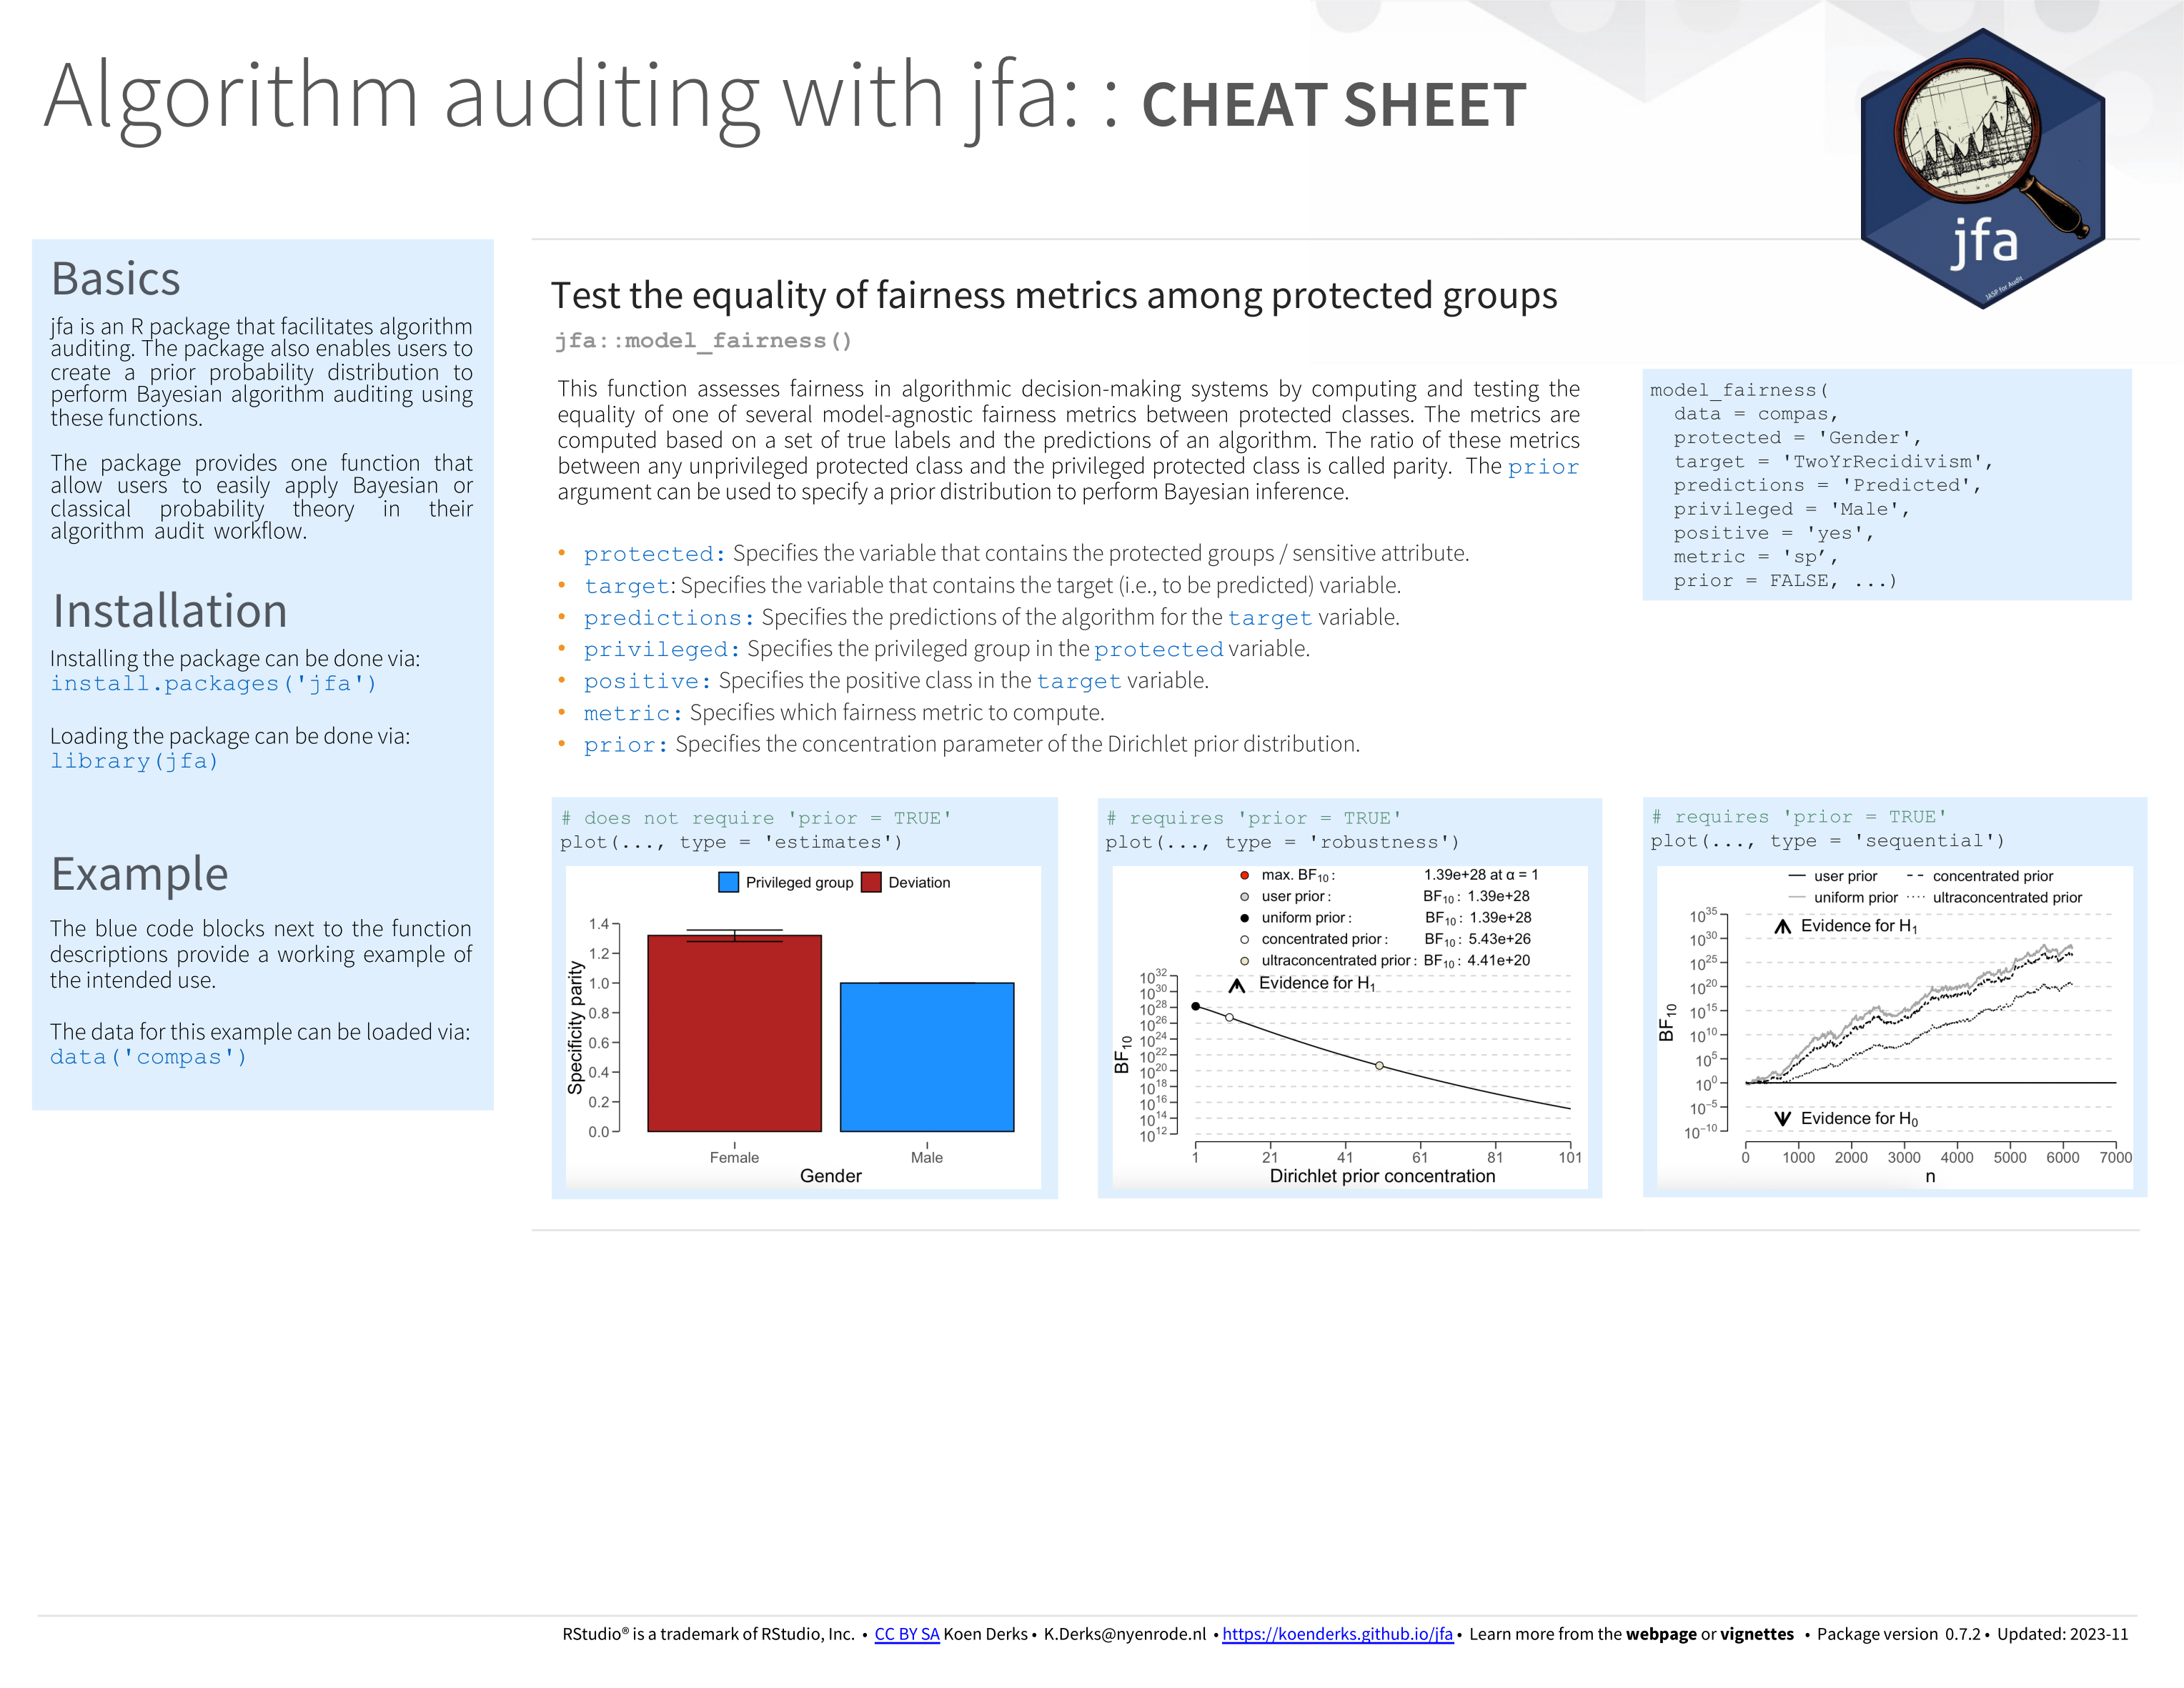
The cheat sheet below will help you get started with jfa’s algorithm audit functionality. A pdf version can be downloaded here.
