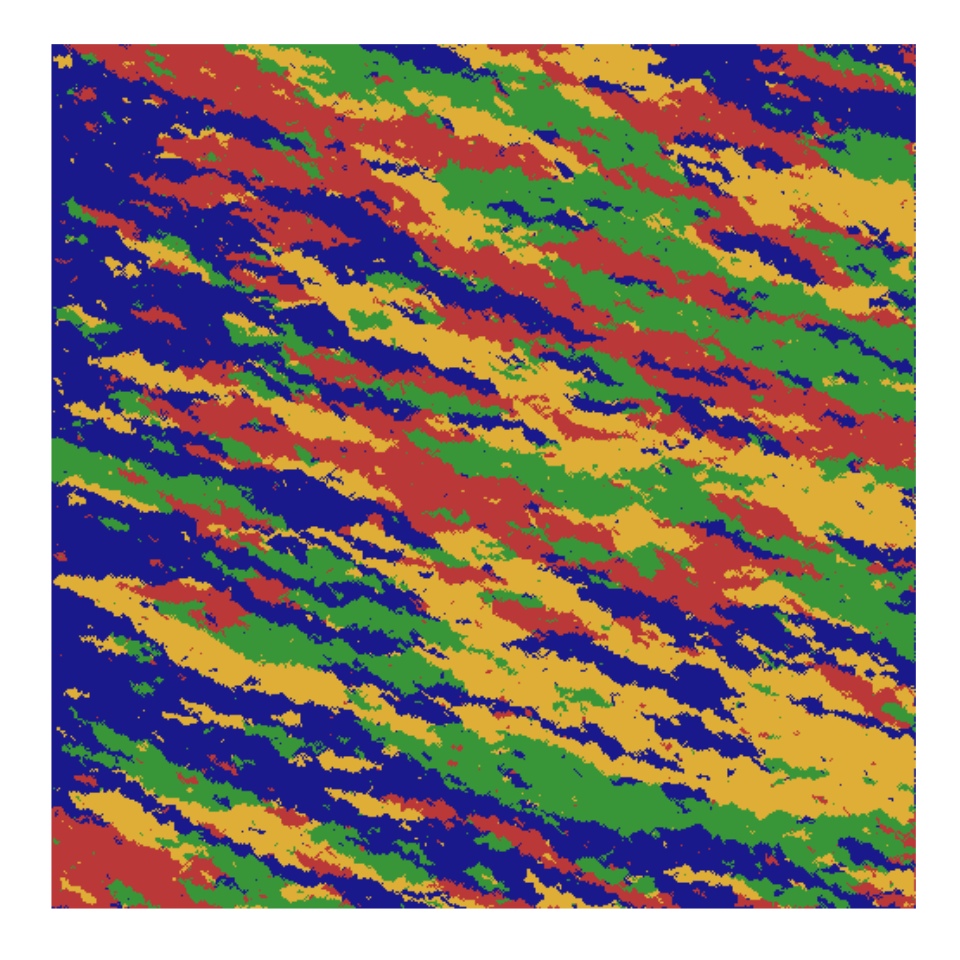
This function creates an artwork that resembles paints strokes. The algorithm is based on the simple idea that each next point on the grid has a chance to take over the color of an adjacent colored point but also has a change of generating a new color.
canvas_strokes(
  colors,
  neighbors = 1,
  p = 0.01,
  iterations = 1,
  resolution = 500,
  side = FALSE
)
Arguments
- colors
a string or character vector specifying the color(s) used for the artwork.
- neighbors
a positive integer specifying the number of neighbors a block considers when taking over a color. More neighbors fades the artwork.
- p
a value specifying the probability of selecting a new color at each block. A higher probability adds more noise to the artwork.
- iterations
a positive integer specifying the number of iterations of the algorithm. More iterations generally apply more fade to the artwork.
- resolution
resolution of the artwork in pixels per row/column. Increasing the resolution increases the quality of the artwork but also increases the computation time exponentially.
- side
logical. Whether to put the artwork on its side.
Value
A ggplot object containing the artwork.
See also
colorPalette
Examples
# \donttest{
set.seed(1)

# Simple example
canvas_strokes(colors = colorPalette("tuscany1"))

# }
# }