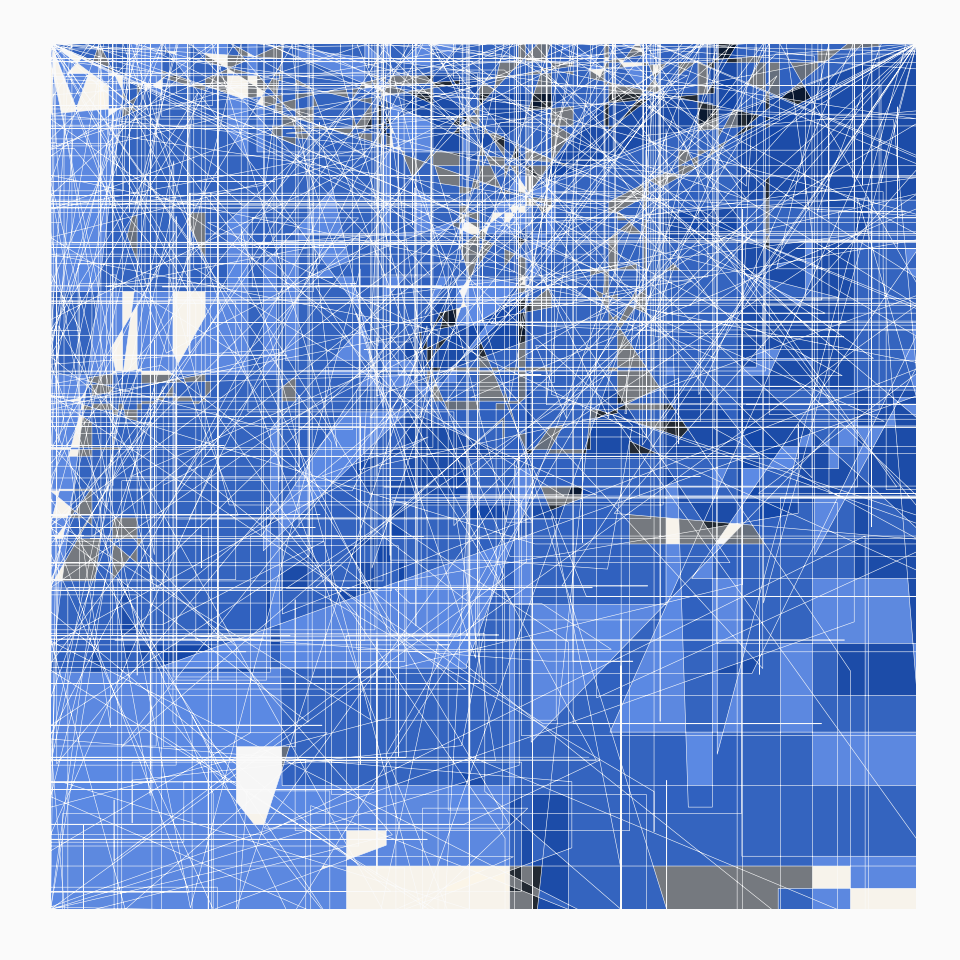
This function draws many points on the canvas and connects these points into a polygon. After repeating this for all the colors, the edges of all polygons are drawn on top of the artwork.
canvas_polylines(
  colors,
  background = "#fafafa",
  ratio = 0.5,
  iterations = 1000,
  size = 0.1,
  resolution = 500
)
Arguments
- colors
a string or character vector specifying the color(s) used for the artwork.
- background
a character specifying the color used for the lines.
- ratio
a positive value specifying the width of the polygons. Larger ratios cause more overlap.
- iterations
a positive integer specifying the number of iterations of the algorithm.
- size
a positive value specifying the size of the borders.
- resolution
resolution of the artwork in pixels per row/column. Increasing the resolution increases the quality of the artwork but also increases the computation time exponentially.
Value
A ggplot object containing the artwork.
See also
colorPalette
Examples
# \donttest{
set.seed(1)

# Simple example
canvas_polylines(colors = colorPalette("retro1"))

# }
# }