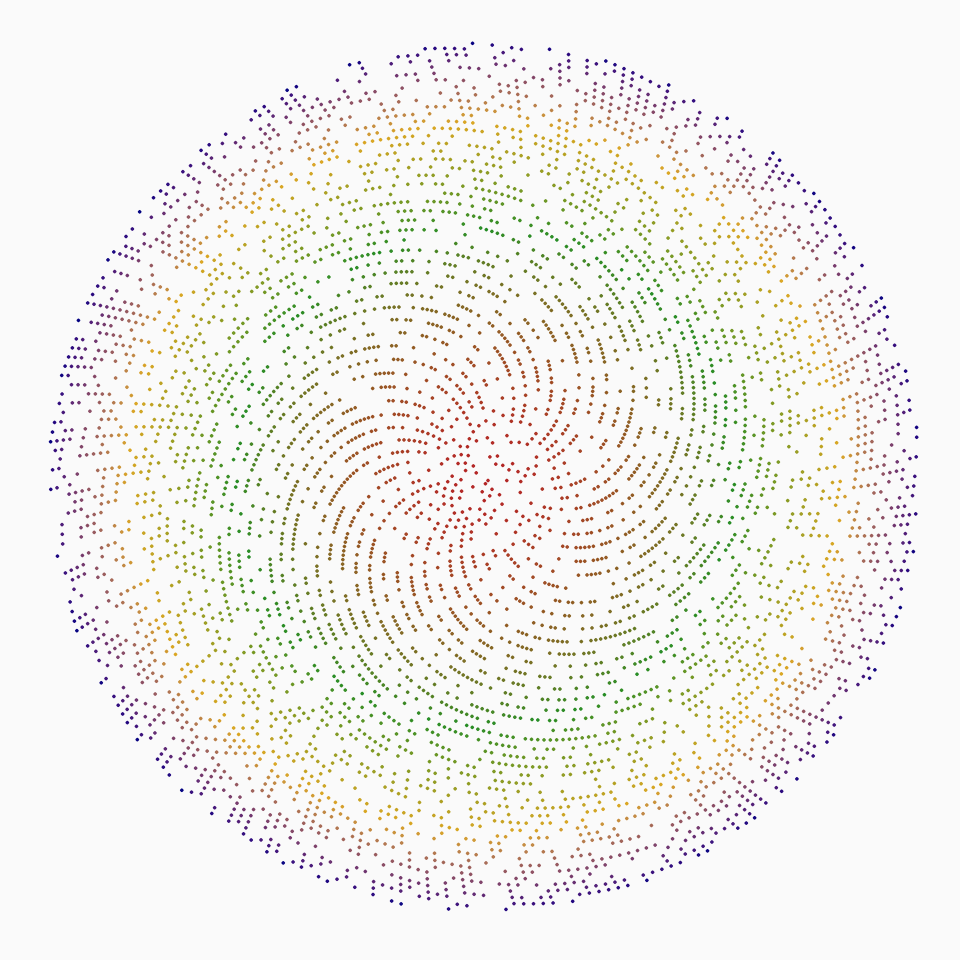
This function draws a phyllotaxis which resembles the arrangement of leaves on a plant stem.
canvas_phyllotaxis(
  colors,
  background = "#fafafa",
  iterations = 10000,
  angle = 137.5,
  size = 0.01,
  alpha = 1,
  p = 0.5
)
Arguments
- colors
a string or character vector specifying the color(s) used for the artwork.
- background
a character specifying the color used for the background.
- iterations
the number of iterations of the algorithm.
- angle
the angle at which to place the artwork.
- size
the size of the lines.
- alpha
transparency of the points.
- p
probability of drawing a point on each iteration.
Value
A ggplot object containing the artwork.
References
See also
colorPalette
Examples
# \donttest{
set.seed(1)

# Simple example
canvas_phyllotaxis(colors = colorPalette("tuscany1"))

# }
# }