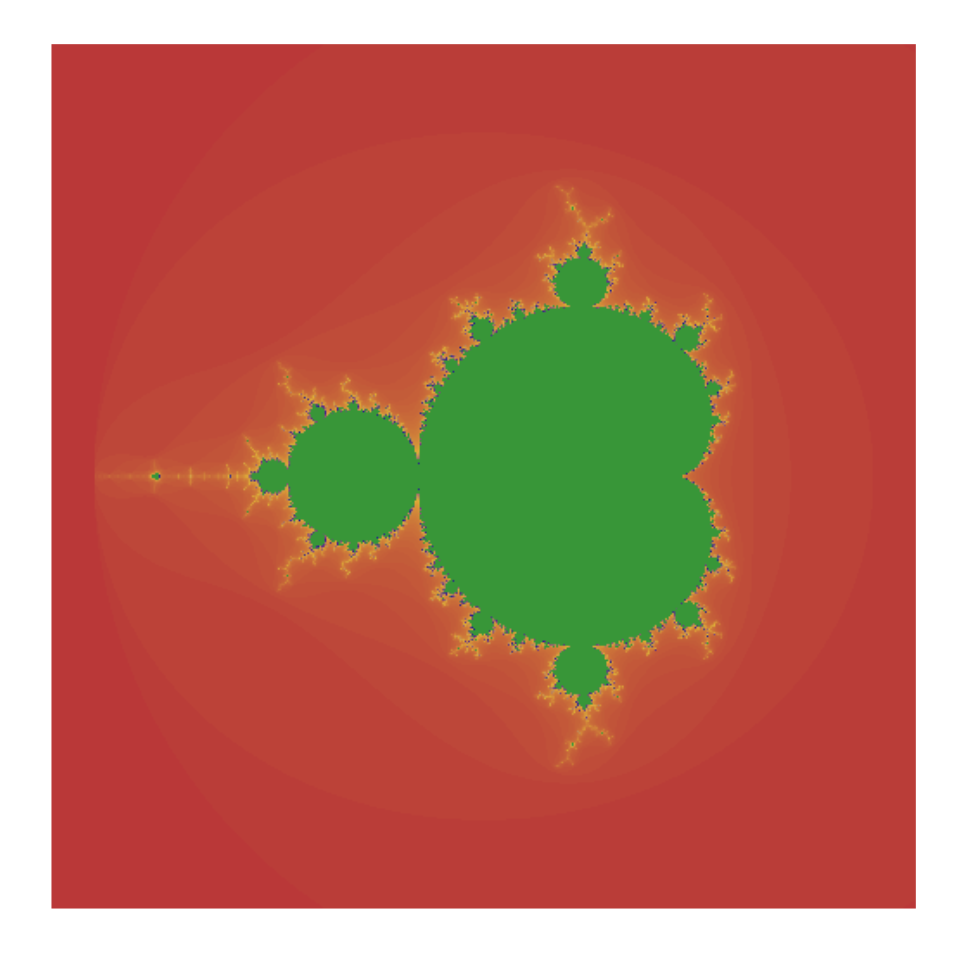
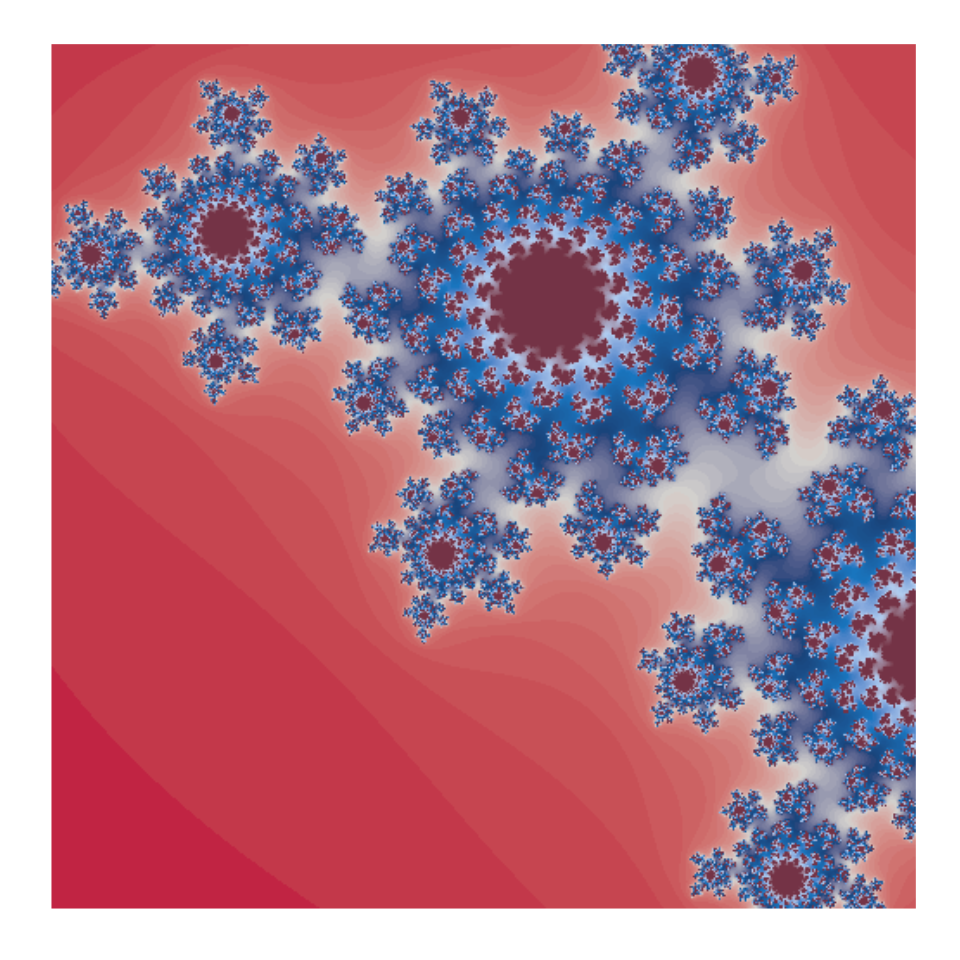
This function draws the Mandelbrot set and other related fractal sets on the canvas.
canvas_mandelbrot(
  colors,
  iterations = 100,
  zoom = 1,
  set = c("mandelbrot", "multibrot", "julia", "ship"),
  left = -2.16,
  right = 1.16,
  bottom = -1.66,
  top = 1.66,
  resolution = 500
)
Arguments
- colors
a string or character vector specifying the color(s) used for the artwork.
- iterations
a positive integer specifying the number of iterations of the algorithm.
- zoom
a positive value specifying the amount of zoom to apply.
- set
a character indicating which fractal set to draw. Possible options are
mandelbrotfor the Mandelbrot set,multibrotfor variations of the Mandelbrot set (aka the Multibrot sets),juliafor the Julia set andshipfor the Burning ship set.- left
a value specifying the minimum location on the x-axis.
- right
a value specifying the maximum location on the x-axis.
- bottom
a value specifying the minimum location on the y-axis.
- top
a value specifying the maximum location on the y-axis.
- resolution
resolution of the artwork in pixels per row/column. Increasing the resolution increases the quality of the artwork but also increases the computation time exponentially.
Value
A ggplot object containing the artwork.
References
See also
colorPalette
Examples
# \donttest{
canvas_mandelbrot(colors = colorPalette("tuscany1"), set = "mandelbrot")

canvas_mandelbrot(colors = colorPalette("flag"), set = "julia", zoom = 2)

# }
# }