This function draws flow fields on a canvas. The algorithm simulates the flow of points through a field of angles which can be set manually or generated from the predictions of a supervised learning method (i.e., knn, svm, random forest) trained on randomly generated data.
canvas_flow(
  colors,
  background = "#fafafa",
  lines = 500,
  lwd = 0.05,
  iterations = 100,
  stepmax = 0.01,
  outline = c("none", "circle", "square"),
  polar = FALSE,
  angles = NULL
)
Arguments
- colors
a string or character vector specifying the color(s) used for the artwork.
- background
a character specifying the color used for the background.
- lines
the number of lines to draw.
- lwd
expansion factor for the line width.
- iterations
the maximum number of iterations for each line.
- stepmax
the maximum proportion of the canvas covered in each iteration.
- outline
character. Which outline to use for the artwork. Possible options are
none(default),circleorsquare.- polar
logical. Whether to draw the flow field with polar coordinates.
- angles
optional, a 200 x 200 matrix containing the angles in the flow field, or a character indicating the type of noise to use (
svm,knn,rf,perlin,cubic,simplex, orworley). IfNULL(the default), the noise type is chosen randomly.
Value
A ggplot object containing the artwork.
See also
colorPalette
Examples
# \donttest{
set.seed(1)
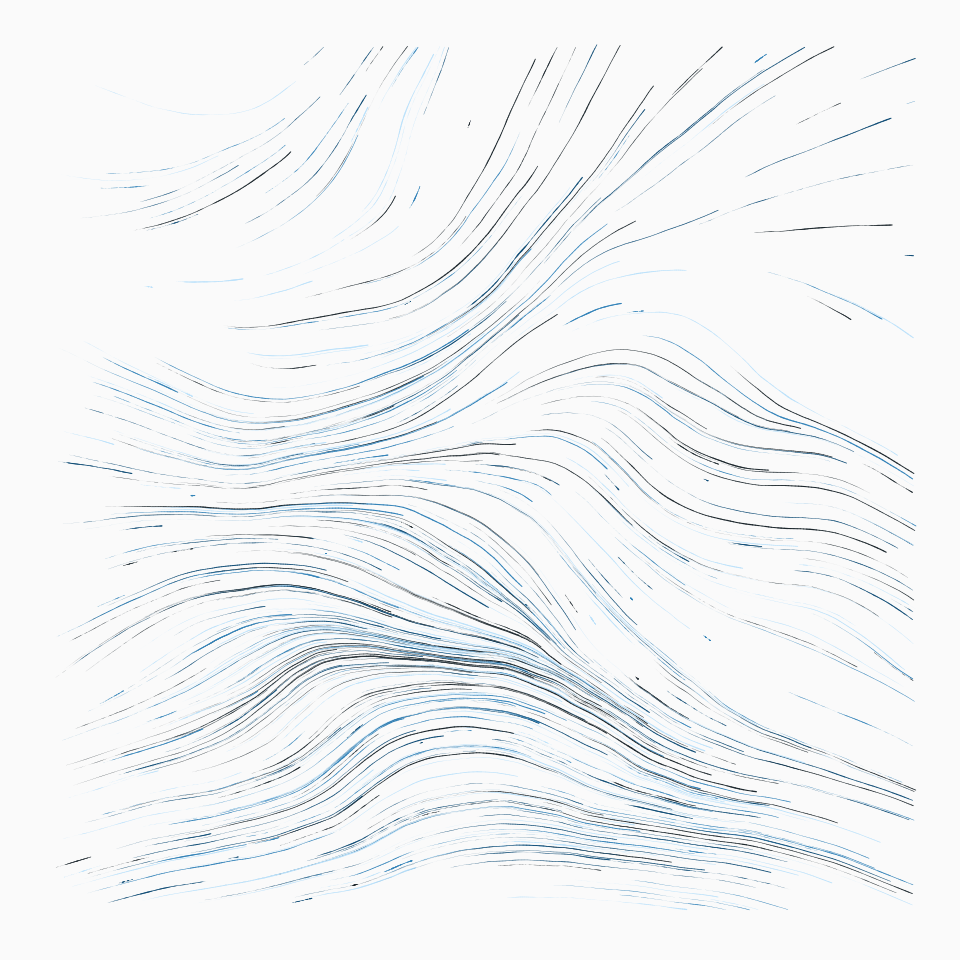
# Simple example
canvas_flow(colors = colorPalette("dark2"))
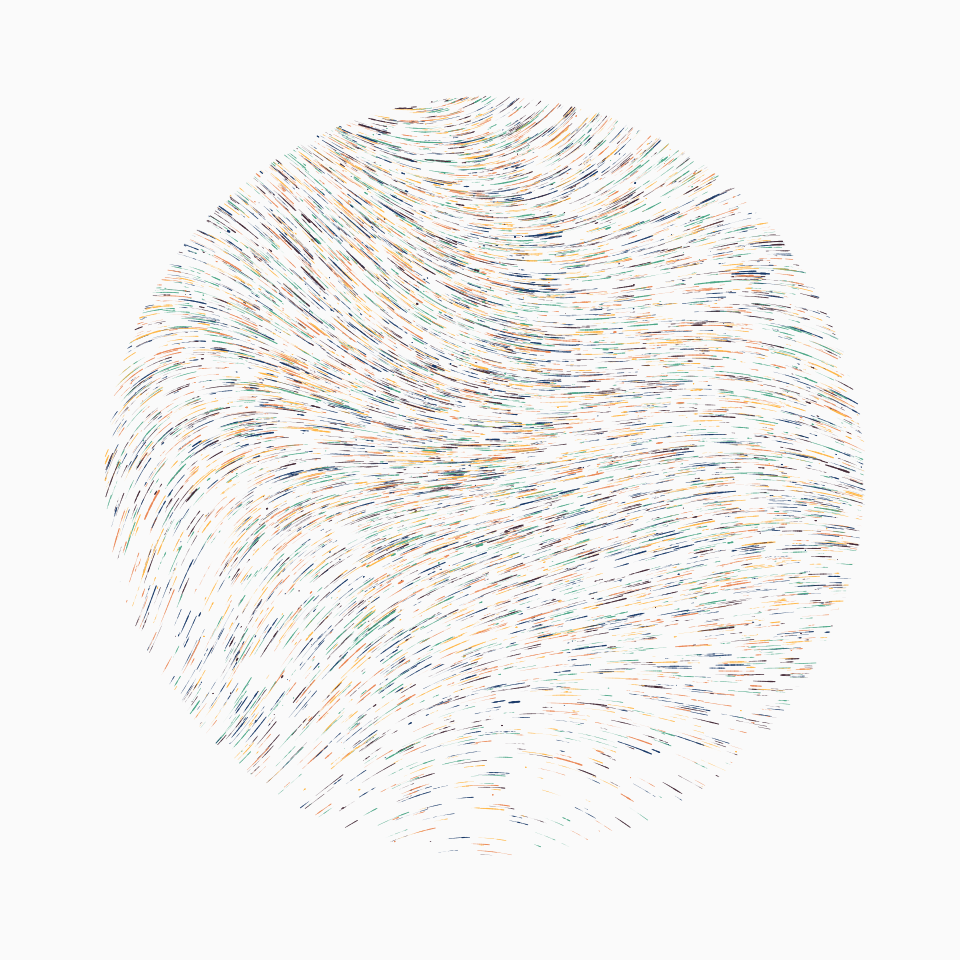
 # Outline example
canvas_flow(
colors = colorPalette("vrolik1"), lines = 10000,
outline = "circle", iterations = 10, angles = "svm"
)
# Outline example
canvas_flow(
colors = colorPalette("vrolik1"), lines = 10000,
outline = "circle", iterations = 10, angles = "svm"
)
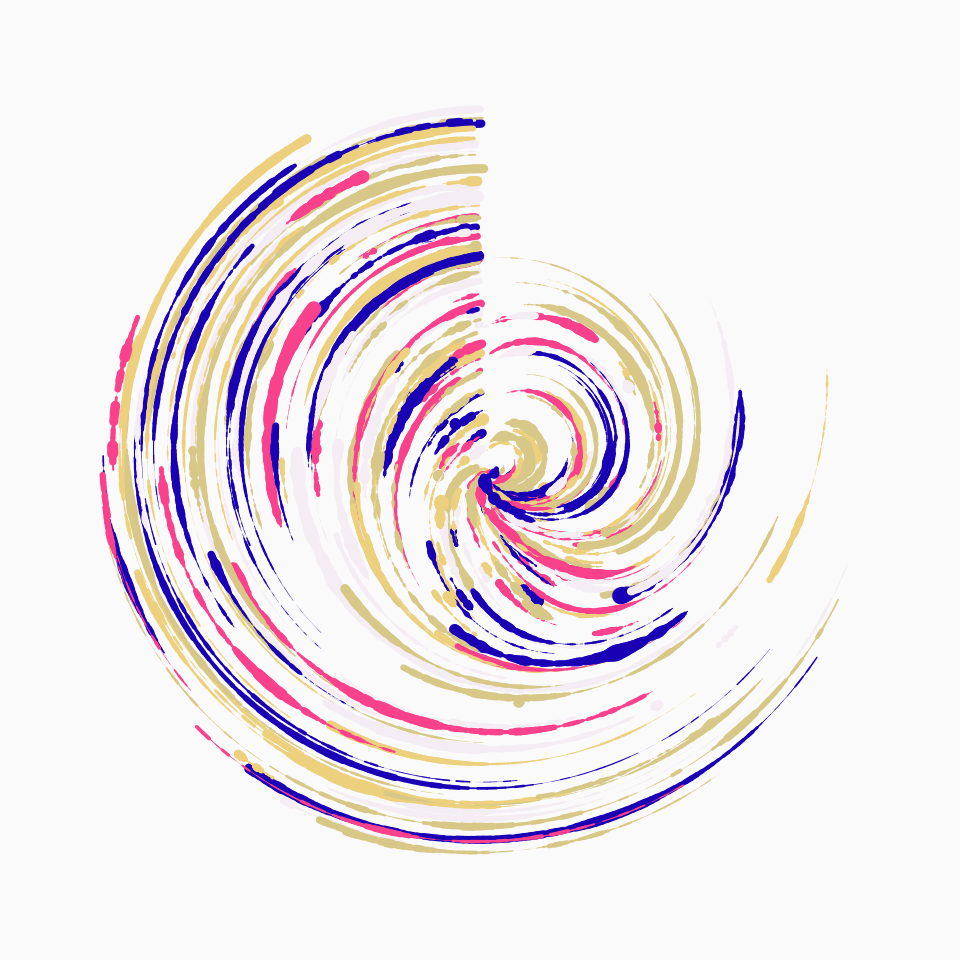
 # Polar example
canvas_flow(
colors = colorPalette("vrolik2"), lines = 300,
lwd = 0.5, polar = TRUE
)
# Polar example
canvas_flow(
colors = colorPalette("vrolik2"), lines = 300,
lwd = 0.5, polar = TRUE
)
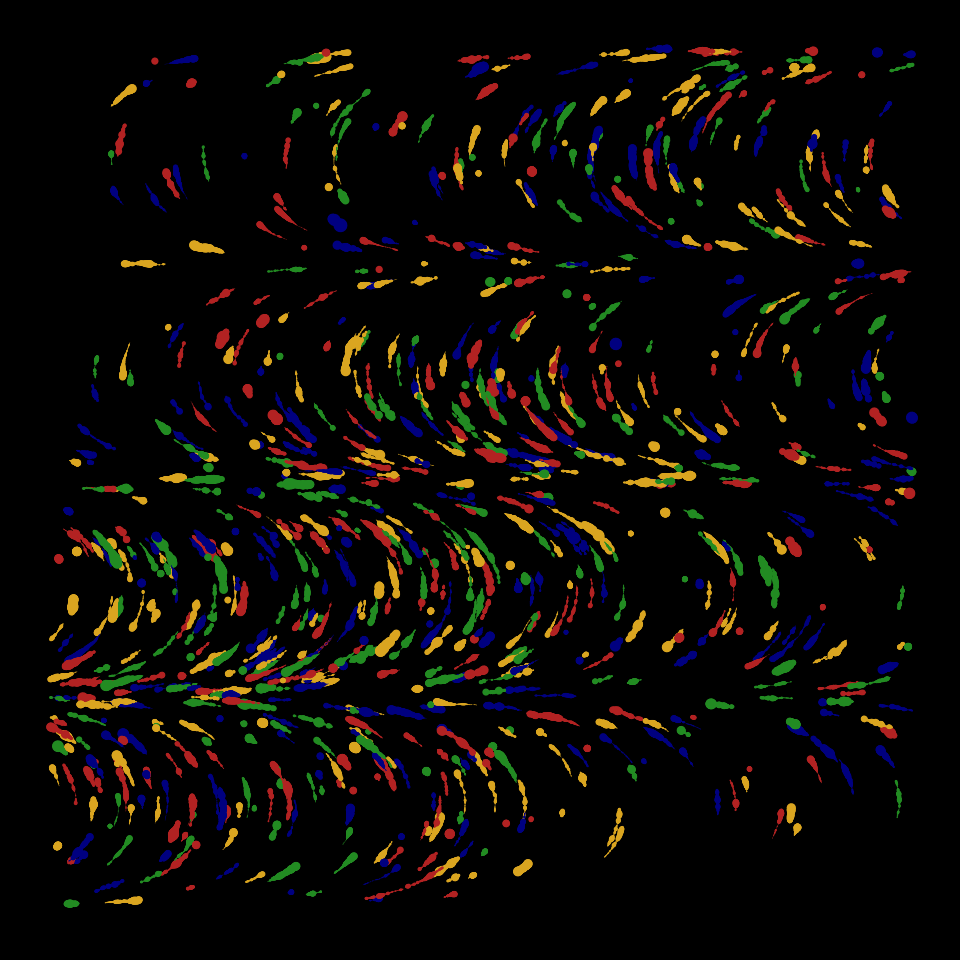
 # Advanced example
angles <- matrix(0, 200, 200)
angles[1:100, ] <- seq(from = 0, to = 2 * pi, length = 100)
angles[101:200, ] <- seq(from = 2 * pi, to = 0, length = 100)
angles <- angles + rnorm(200 * 200, sd = 0.1)
canvas_flow(
colors = colorPalette("tuscany1"), background = "black",
angles = angles, lwd = 0.4, lines = 1000, stepmax = 0.001
)
# Advanced example
angles <- matrix(0, 200, 200)
angles[1:100, ] <- seq(from = 0, to = 2 * pi, length = 100)
angles[101:200, ] <- seq(from = 2 * pi, to = 0, length = 100)
angles <- angles + rnorm(200 * 200, sd = 0.1)
canvas_flow(
colors = colorPalette("tuscany1"), background = "black",
angles = angles, lwd = 0.4, lines = 1000, stepmax = 0.001
)
 # }
# }