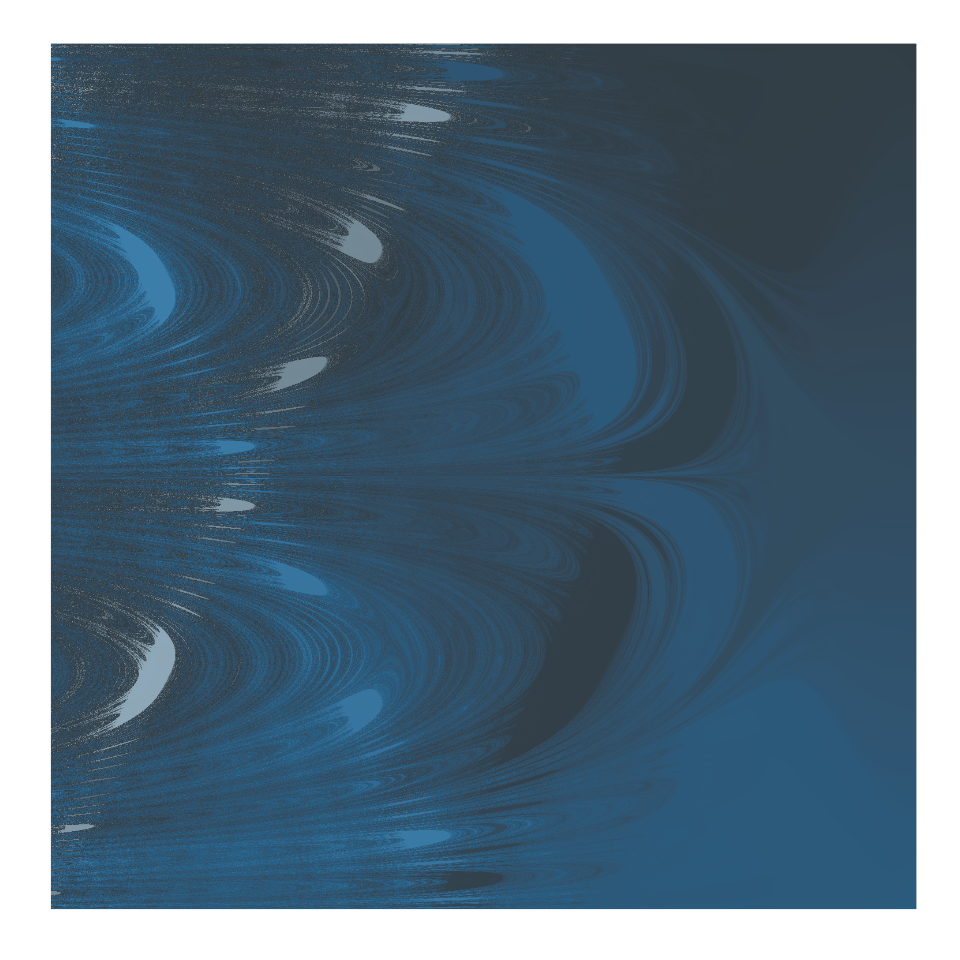
This function draws a circle map on a canvas. A circle map is a nonlinear dynamic system that can exhibit a phenomenon known as Arnold's tongue: a visualization of the frequency-locking behavior of a nonlinear oscillator with a periodic external force. The tongue is a region in the parameter space of the oscillator where the frequency of the oscillator matches the frequency of the external force. The tongue appears as a series of tongues of varying widths and shapes that can extend into regions of the parameter space where the frequency locking does not occur.
canvas_circlemap(
  colors,
  left = 0,
  right = 12.56,
  bottom = 0,
  top = 1,
  iterations = 10,
  resolution = 1500
)
Arguments
- colors
a string or character vector specifying the color(s) used for the artwork.
- left
a value specifying the minimum location on the x-axis.
- right
a value specifying the maximum location on the x-axis.
- bottom
a value specifying the minimum location on the y-axis.
- top
a value specifying the maximum location on the y-axis.
- iterations
a positive integer specifying the number of iterations of the algorithm.
- resolution
resolution of the artwork in pixels per row/column. Increasing the resolution increases the quality of the artwork but also increases the computation time exponentially.
Value
A ggplot object containing the artwork.
References
See also
colorPalette
Examples
# \donttest{
canvas_circlemap(colors = colorPalette("dark2"))

# }
# }